Log Management
Collect, search, and correlate logs from your entire stack. Cloud, on-prem, and containers — without blowing your observability budget.
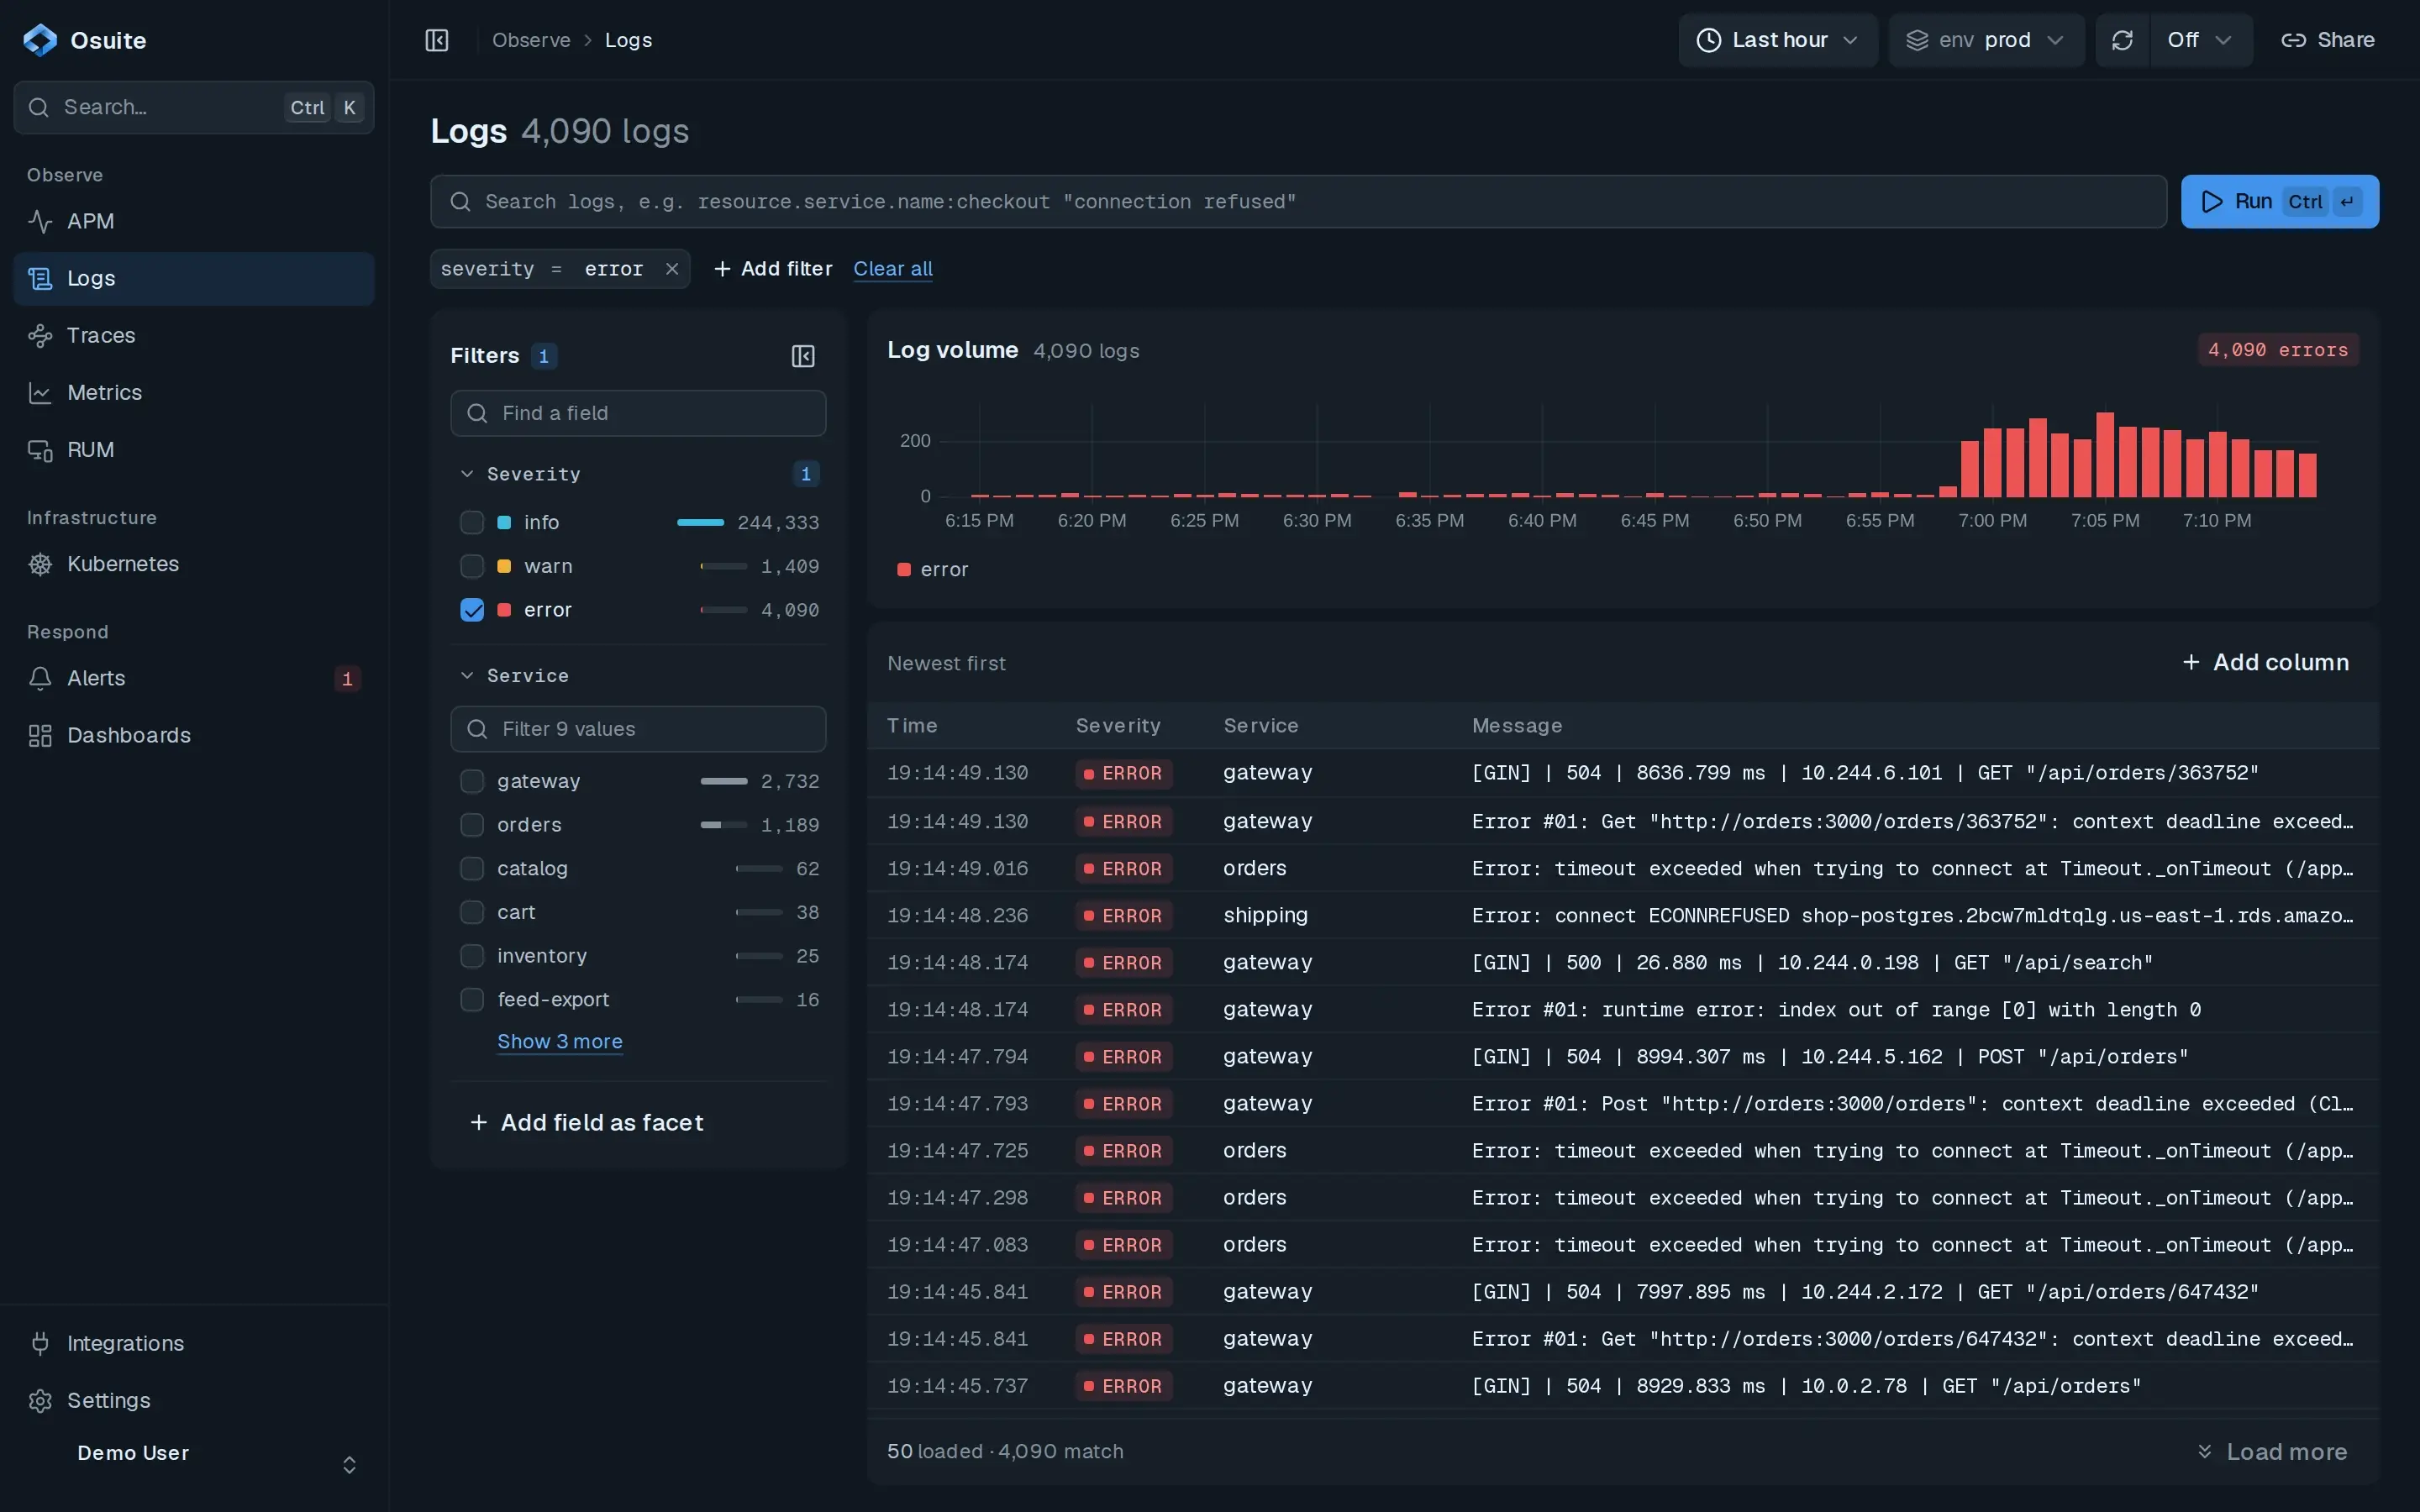
Error volume spikes
Every error line, newest first
- Error volume spikes
- Every error line, newest first
Everything your logs need. Nothing you don't.
Ingest at any scale
Process millions of logs per minute with cost-efficient ingestion and flexible retention controls
Search in milliseconds
Fully indexed logs with instant full-text search, custom filters, and on-the-fly property tagging
Never investigate in isolation
Correlate logs with traces and metrics — and let the investigation agent in your IDE find the root cause and a fix
Live tail
From the whole stream to the line that matters
Toggle a filter or a facet. The tail narrows, every count updates and the error spike surfaces, the way search works in Osuite.
Toggle a filter or a facet
- 19:14:55.530INFOgateway[GIN] | 200 | 41.207 ms | 10.0.0.209 | GET "/api/products"
- 19:14:55.212INFOcatalog[GIN] | 200 | 6.418 ms | 10.0.1.44 | GET "/products"
- 19:14:54.918INFOcart[GIN] | 200 | 3.902 ms | 10.0.2.15 | GET "/carts/c-90412"
- 19:14:54.186ERRORgateway[GIN] | 504 | 8061.774 ms | 10.0.0.209 | GET "/api/orders/724018"
- 19:14:54.186ERRORgatewayError #01: Get "http://orders:3000/orders/724018": context deadline exceeded (Client.Timeout exceeded while awaiting headers)
- 19:14:53.940INFOpayments10.0.3.17:52144 - "GET /payments/48211 HTTP/1.1" 200
- 19:14:53.655WARNinventoryUnclosed client session client_session: <aiohttp.client.ClientSession object at 0x7f3a2c1d9e80>
- 19:14:53.301INFOusersGET /users/40213 200 734 - 14.022 ms
- 19:14:52.987INFOgateway[GIN] | 200 | 52.660 ms | 10.0.0.209 | GET "/api/cart"
- 19:14:52.469INFOordersGET /orders/724018 500 19776 - 4741.902 ms
- 19:14:52.469ERRORordersError: timeout exceeded when trying to connect at Timeout._onTimeout (/app/node_modules/pg-pool/index.js:45:11)
- 19:14:52.130INFOshippingGET /shipments/88412 200 642 - 22.884 ms
matched 1,217,205 of 1.22M in 38 msexample
Newest first
Logging at Scale
- Send and process millions of logs per minute without performance degradation
- Set custom retention policies per log type and archive to S3 for long-term storage
- Control ingestion volume and costs with configurable sampling and rate limits
Spikes stand out at a glance
Matching lines, newest first
- Spikes stand out at a glance
- Matching lines, newest first
Correlated Signals
- Jump from a log line directly to the related trace or metric in one click
- View all log properties, filter by any attribute, and add custom properties on the fly
- Reduce MTTD by investigating logs, traces, and metrics in a single unified view
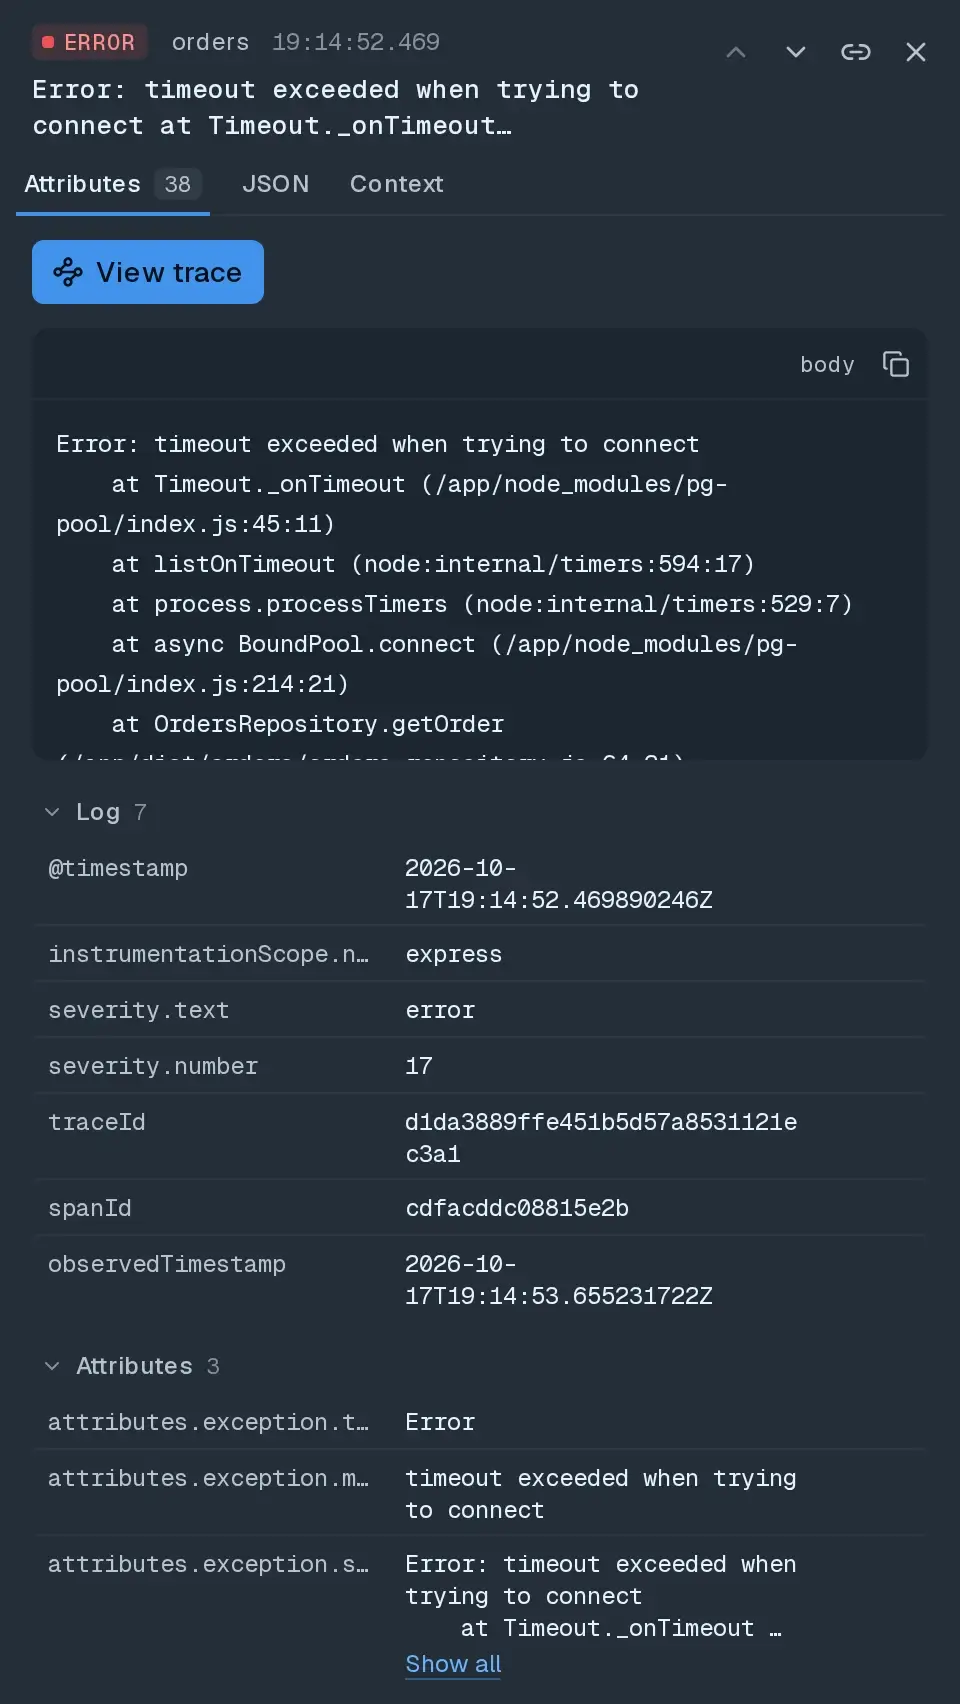
One click to its trace
The full stack, not a truncated line
- One click to its trace
- The full stack, not a truncated line
Powerful Search and Filtering
- Fully indexed logs for sub-second search across millions of events
- Build and save complex filter queries without learning a proprietary query language
- Real-time log tailing to monitor live systems as events stream in
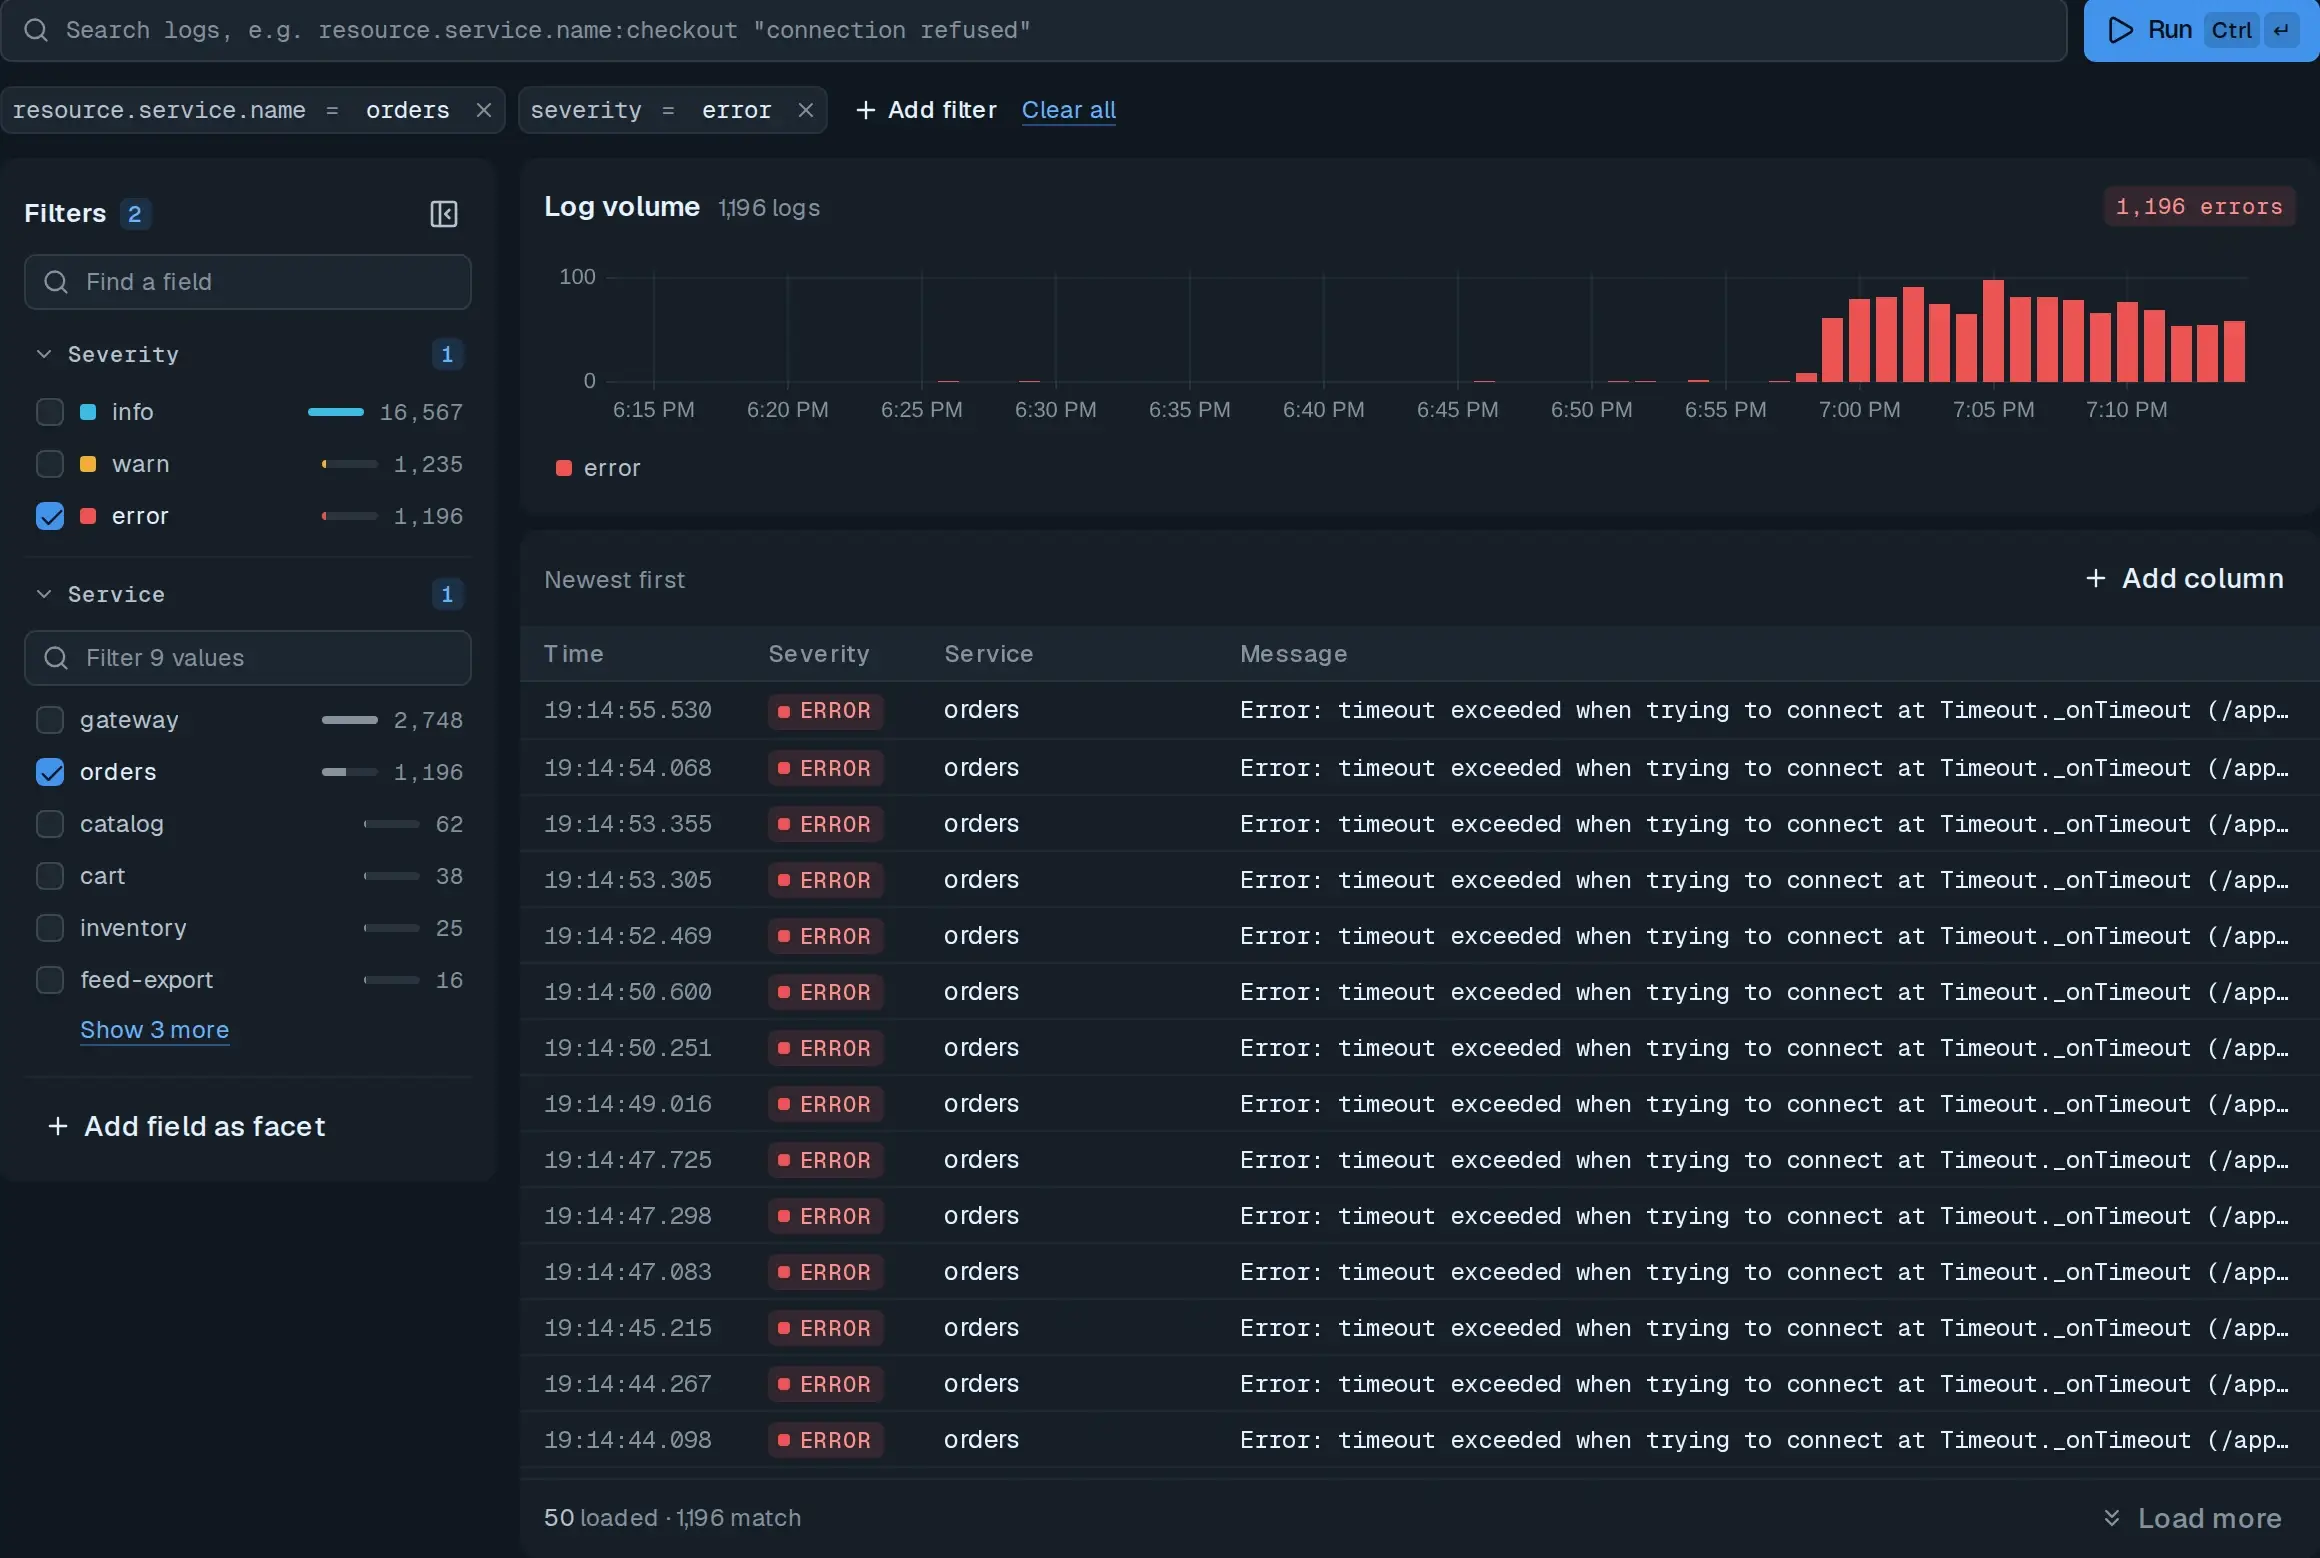
A count beside every value
- A count beside every value
Comprehensive Integrations
- OpenTelemetry native — collect logs from any language, framework, or cloud backend
- Pre-built integrations for the most common log sources, ready out of the box
- No custom agents or code changes required if you're already emitting OTel data