Live in 1 hour. Find root cause and fix in minutes.
AI-native observability. One agent instruments your stack in minutes; another lives in your IDE and hands you the root cause and a fix — tracing any failure from a click to the query behind it.
Trusted by innovative teams


 Vibe3D
 The dashboard era of observability is over
Observability used to mean weeks of setup and walls of dashboards you had to read yourself. AI-native observability does the work for you — from signal, to root cause, to a fix, without leaving your editor.
The old way
- Weeks of setup before you see a single trace
- Walls of dashboards you have to already know how to read
- Alerts that tell you something broke — then you dig for hours
- You are the correlation engine, stitching signals together by hand
AI-native observability
- An agent instruments your whole stack in minutes — live in under an hour
- Ask in plain language. No PromQL, no dashboard archaeology
- An investigation agent in your IDE hands you the root cause and a fix
- The machine does the correlating — from a frontend click to the database query
Instrument any stack in minutes, not weeks.
The Osuite instrumentation agent wires up logs, traces, and metrics across any language or framework in about five minutes. It's built on OpenTelemetry, the open standard — if your stack emits telemetry, Osuite speaks its language. No custom agents, no rip-and-replace, no vendor lock-in. Most teams are live in production in under an hour.

Platform
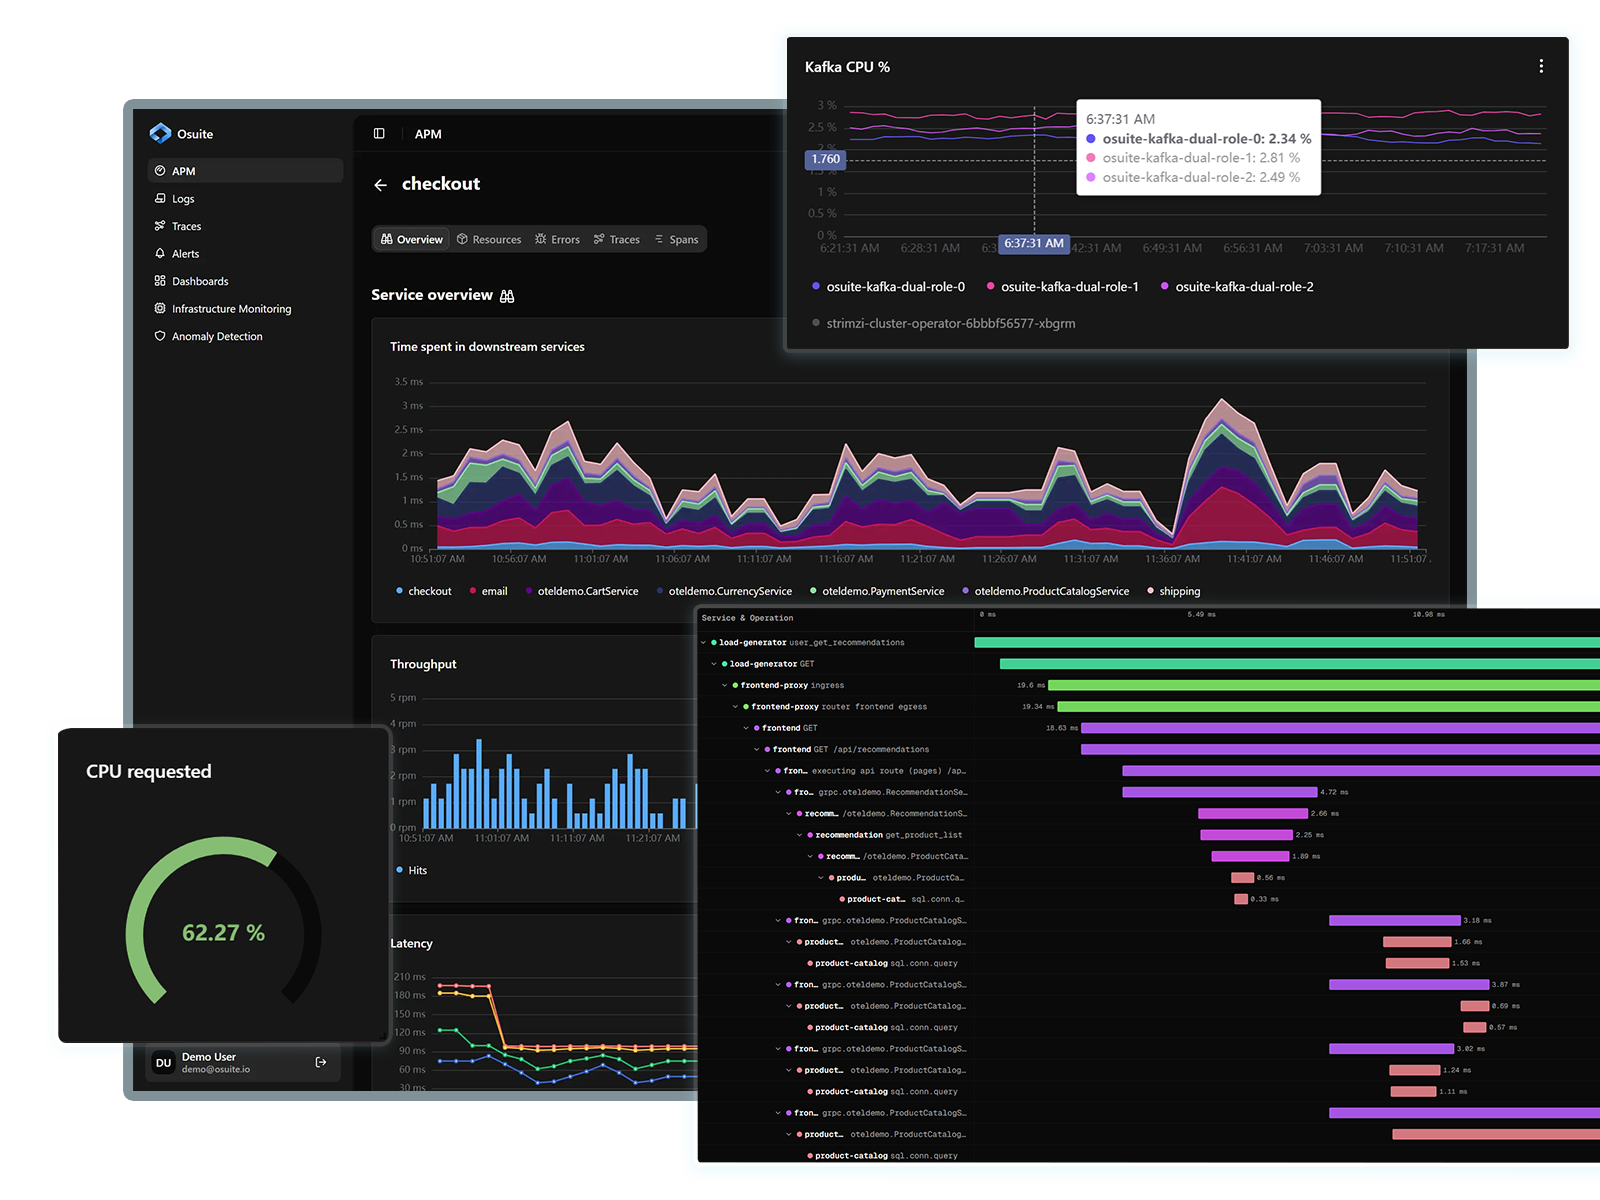
Everything correlated, in one place
Logs, traces, metrics, RUM, and infrastructure — connected from a frontend click to the database query, with an investigation agent on top.
Log Management at Scale
Collect logs from your entire stack: cloud, on-prem, containers and search through millions of events in milliseconds.
- Send and process millions of logs per minute with cost-efficient ingestion
- Full-text search with custom retention policies and S3 archival
- Correlate logs with traces and metrics to pinpoint issues in context

Trusted by teams who've been burned by complexity and cost
See how fast-moving teams cut setup from weeks to an hour and resolve incidents in minutes with Osuite.
How Miden ingests 200 million+ traces and logs per day from their hyperscaling micro services
“Osuite's on-premise setup delivered complete observability tools in our own AWS environment with zero setup hassle.”
How Infinity keep their finance backend running reliably
“Observability is P0 for us! We have setup full stack observability using Osuite. Integration with our system was done in no time, all thanks to the fantastic technical support from the Osuite team.”
Frequently Asked Questions
See what Osuite can do for your team
Get a personalized walkthrough of the platform and a cost comparison against your current observability stack.
No commitment. No sales pressure. Just a real look at the platform.