Application Performance Monitoring
Monitor every service, catch every bottleneck, and resolve incidents faster — before your users feel a thing.
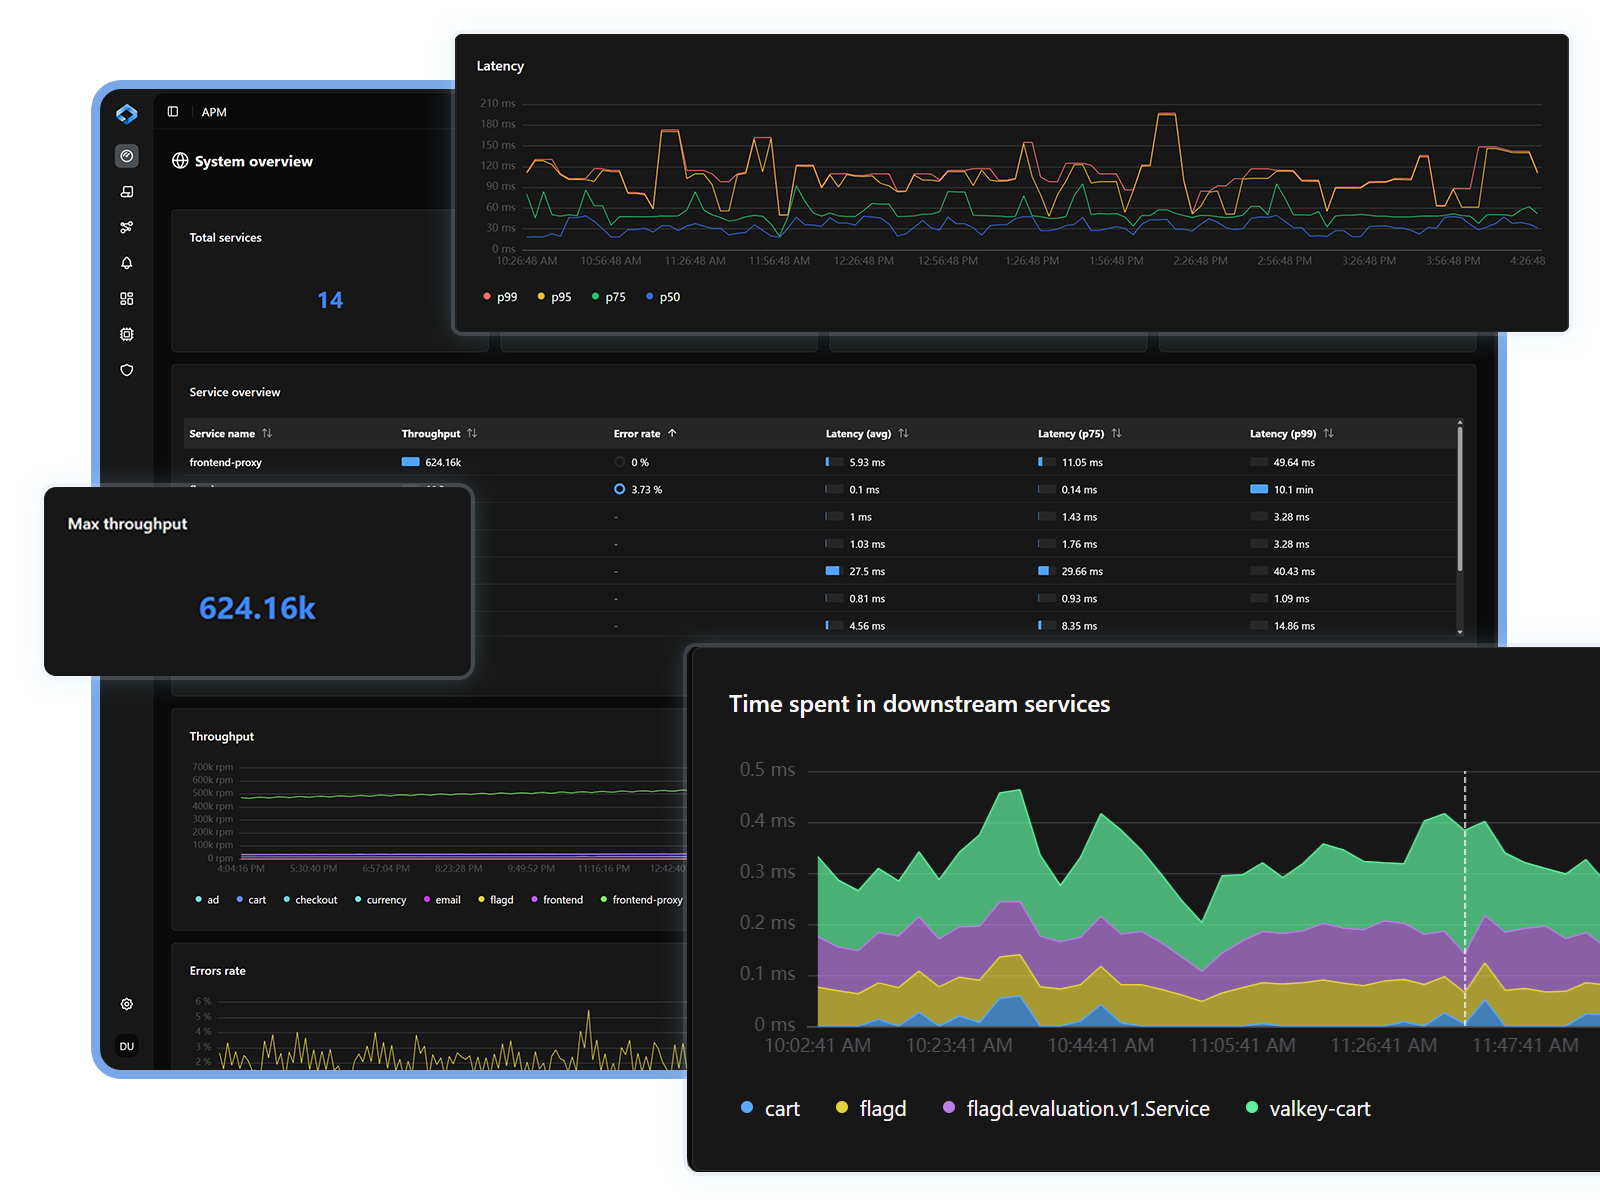
Full visibility into how your applications perform in production.
Golden signal monitoring
Track request rate, error rate, and latency across every backend service in one place
Deep bottleneck detection
Follow slow requests span by span to find the query, dependency, or code path dragging latency
Faster incident resolution
Correlate metrics, traces, and logs — and let the investigation agent in your IDE surface the root cause and a fix
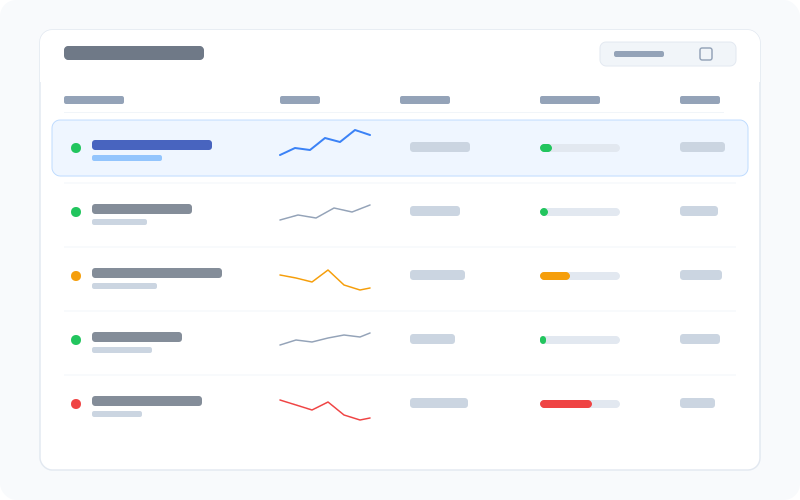
360° Service Visibility
- Monitor all your backend services with key performance metrics in a single unified view
- Track request rate, error rate, and latency trends over time with granular filtering
- Pre-built APM dashboards for the most important metrics, ready the moment you connect
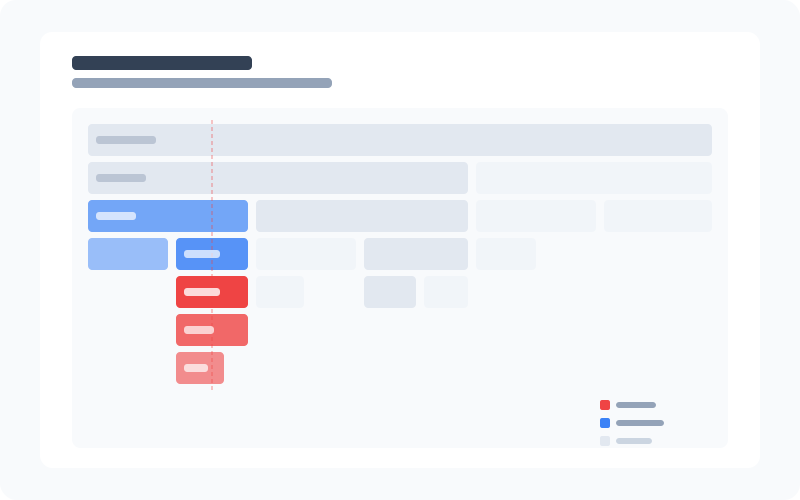
Performance Bottleneck Detection
- Break down every slow request span by span to surface slow queries and expensive dependencies
- Identify the exact span, query, or dependency causing a slowdown deep in your stack
- Compare performance baselines over time to catch regressions before they become incidents
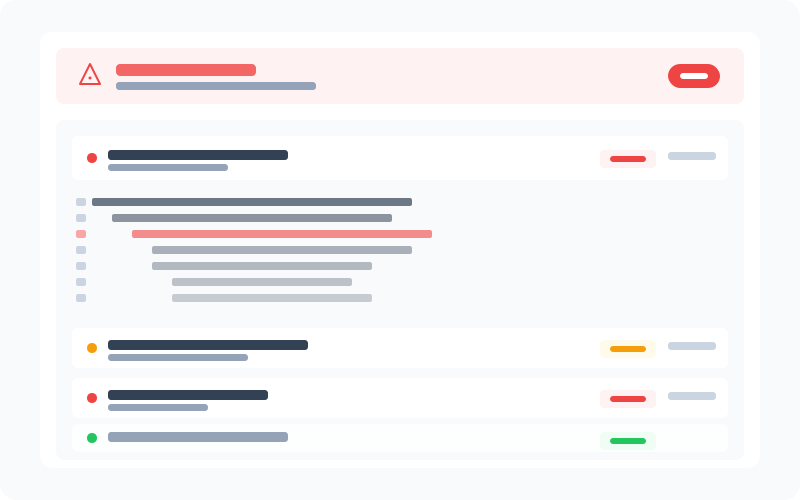
Error Detection and Alerting
- Detect errors across your services with full stack traces for immediate context
- Group, filter, and prioritize errors by frequency, impact, and affected service
- Correlate errors with traces and logs to accelerate root cause analysis
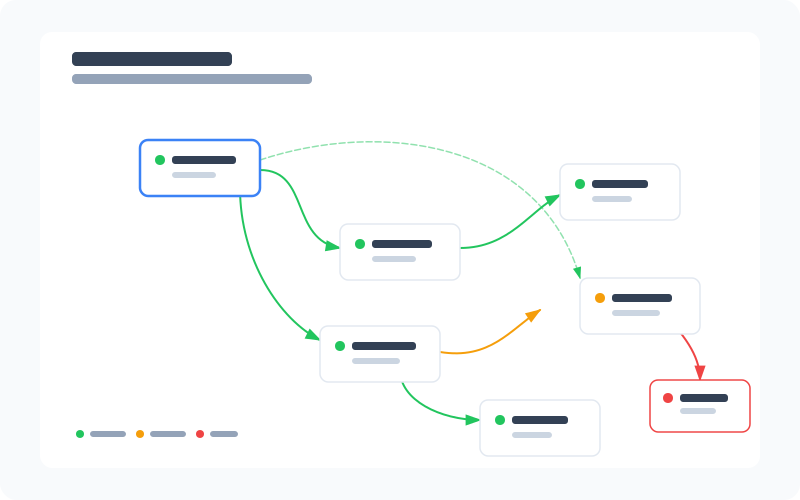
Service Dependency Map
- Visualize dependencies between all your services and understand how they interact
- Node size reflects the relative load on each service, so you can see where traffic concentrates
- Identify which upstream or downstream dependency is the true source of a performance issue