Dashboards That Work the Way You Think
Build production-ready dashboards manually or just describe what you need in plain English. Either way, you're up in minutes.
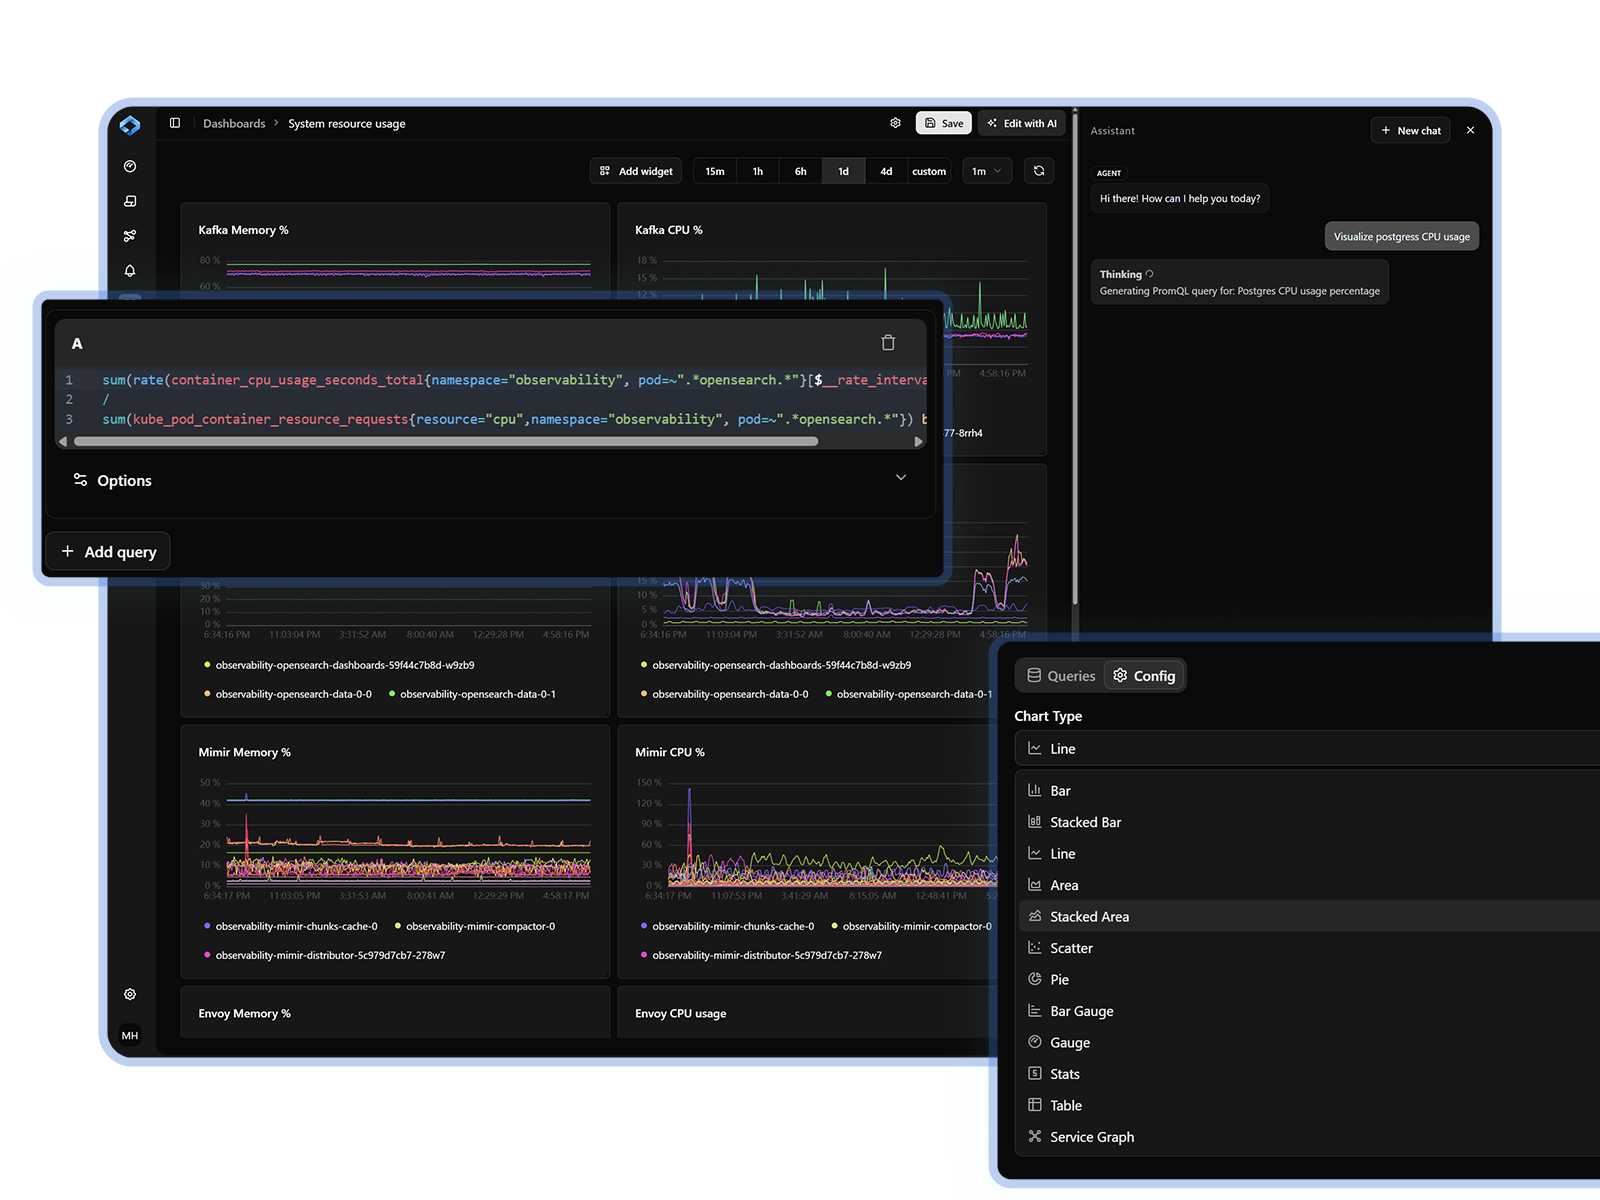
From blank canvas to full visibility — your way.
Build manually or with AI
Use the drag-and-drop builder for full control, or let the Visualizer Agent build it from a plain English description
Any metric, any source
Visualize any OTel metric from any part of your stack on a single dashboard
Share across the team
Dashboards built for on-call engineers, executives, and everyone in between
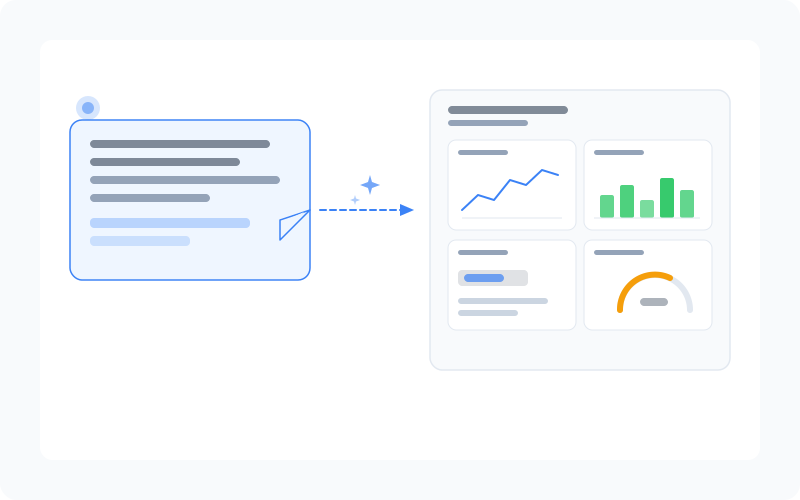
Visualizer Agent — AI-Powered Dashboard Building
- Describe the dashboard you want in plain English and Osuite builds it automatically
- No PromQL, no metric hunting, no guessing which query returns the right data
- Any engineer — regardless of experience level — can create production-ready dashboards instantly
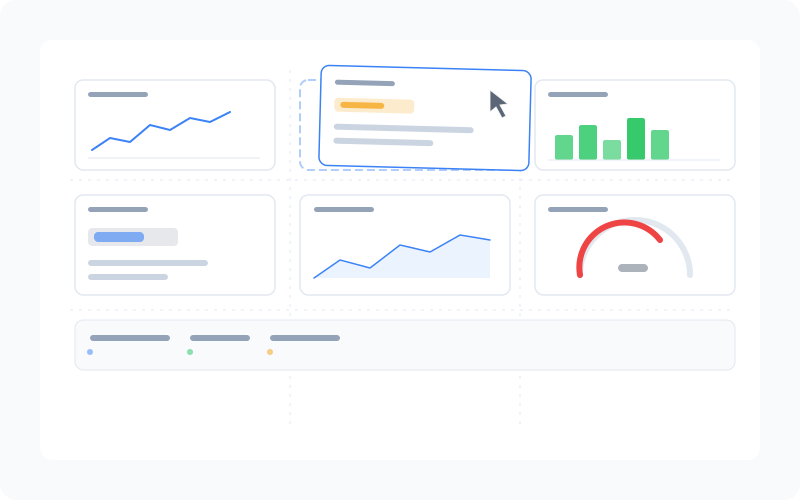
Manual Dashboard Builder
- Drag-and-drop interface to compose dashboards from any metric, log, or trace data in Osuite
- Rich visualization options — time series, heatmaps, bar charts, stat panels, and more
- Save, clone, and templatize dashboards to standardize visibility across teams
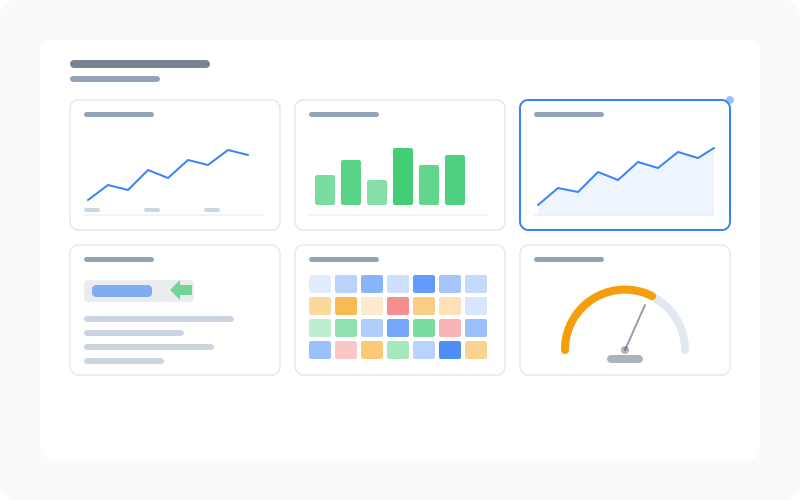
Ingest and Visualize Any Metric
- OpenTelemetry native — ingest custom metrics from any service, tool, or cloud backend
- No limits on what you can visualize — if your stack emits it, Osuite can display it
- Extend pre-built dashboards for Hosts and Kubernetes with your own custom panels
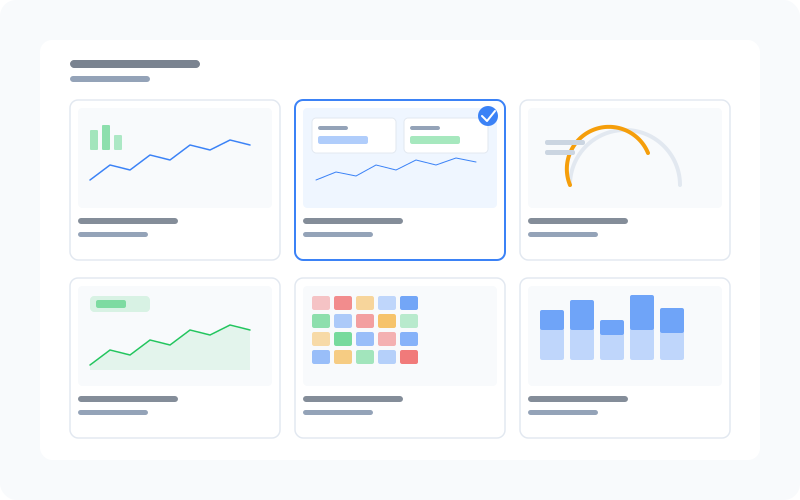
Pre-Built Dashboards
- Out-of-the-box dashboards for the most common use cases — APM, infrastructure, logs, and more
- Start monitoring immediately without building from scratch
- Customize and extend any pre-built dashboard to fit your team's specific needs