Distributed Tracing
Follow every request across every service. Find latency, failures, and broken dependencies with precision — not guesswork.
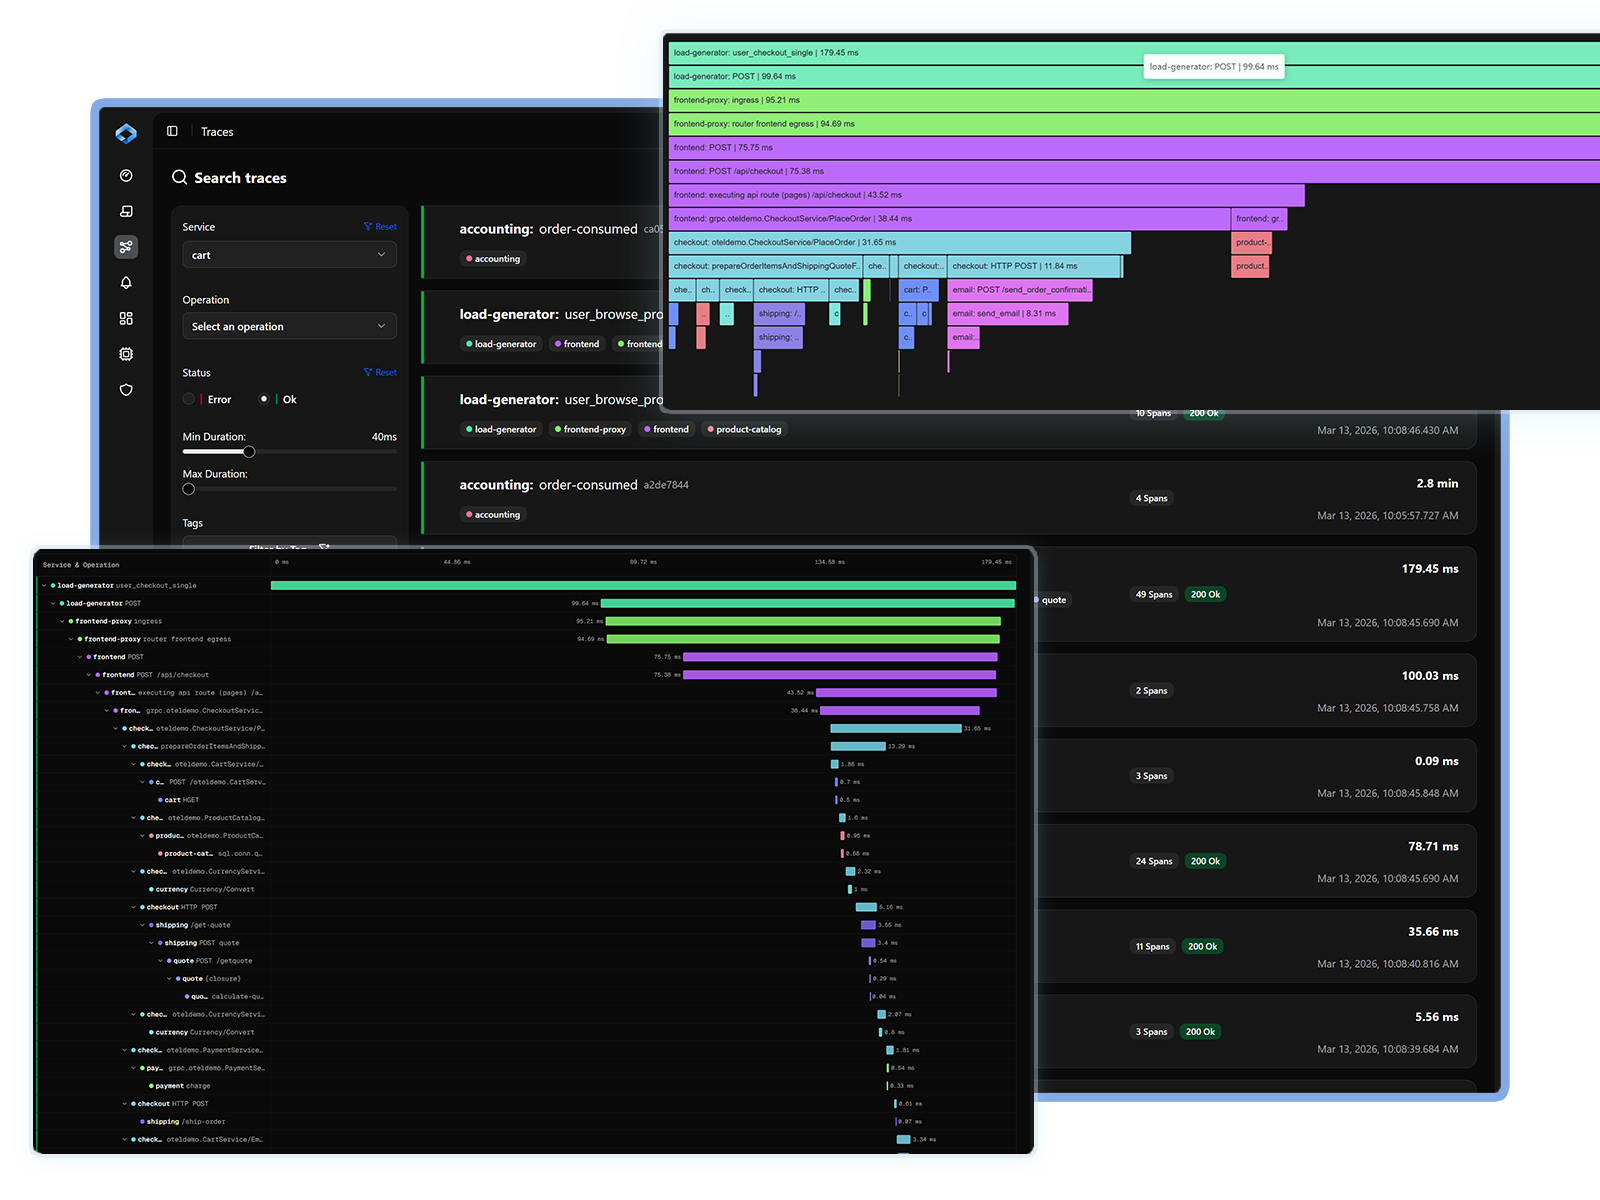
See exactly what happened, and exactly where.
End-to-end visibility
Trace every request across your microservices — from a frontend click to the database query that served it
Powerful analysis tools
Flamegraphs, waterfalls, span lists, and related logs to diagnose any issue
Smart ingestion control
Osuite Ingestion Pipeline with tail-based sampling so you capture what matters without paying for everything
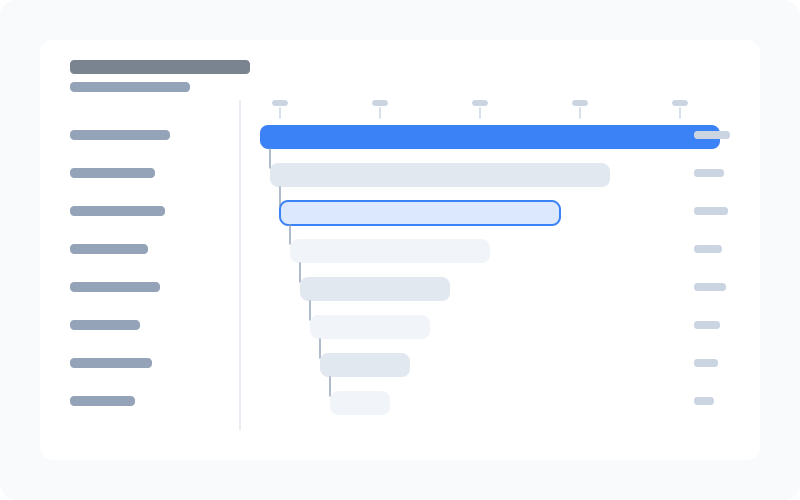
Full Trace Visualization
- Waterfall view to see the full timeline of a request across every service and span
- Flamegraph view to instantly identify where time is being spent in deep call stacks
- Span list view for granular inspection of every operation in a trace
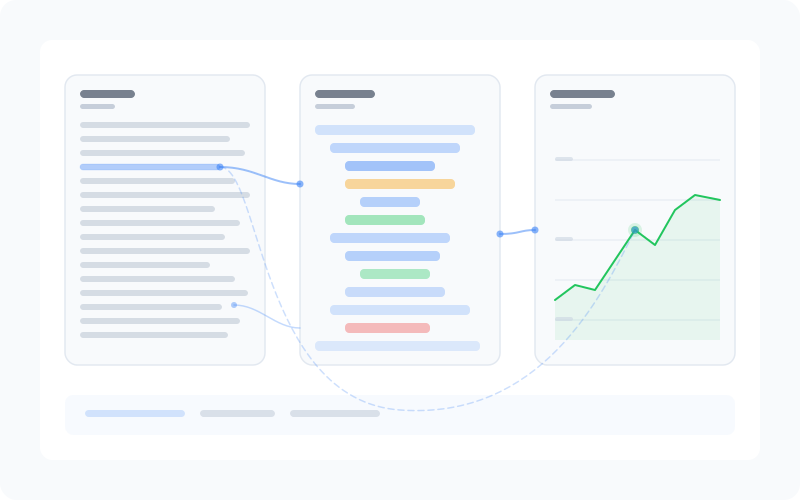
Logs in Trace Context
- Open the Related logs panel on any span to read the logs that span emitted, without leaving the trace
- Filter by trace ID to see every log line from a single request, in order
- Read span timing and log context together to pinpoint the root cause of a slow or failing request
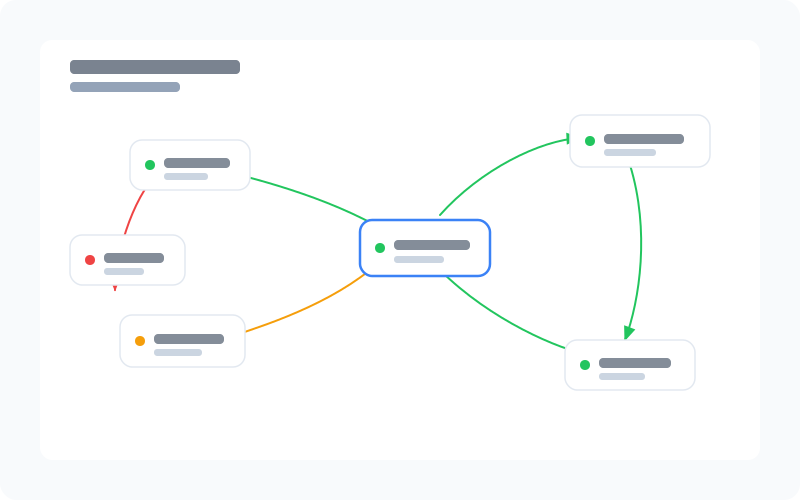
Service Dependency Map
- Automatically discover and visualize dependencies between all your services
- See which services call which, with each node sized by the relative load it handles
- Instantly understand blast radius when a service degrades or goes down
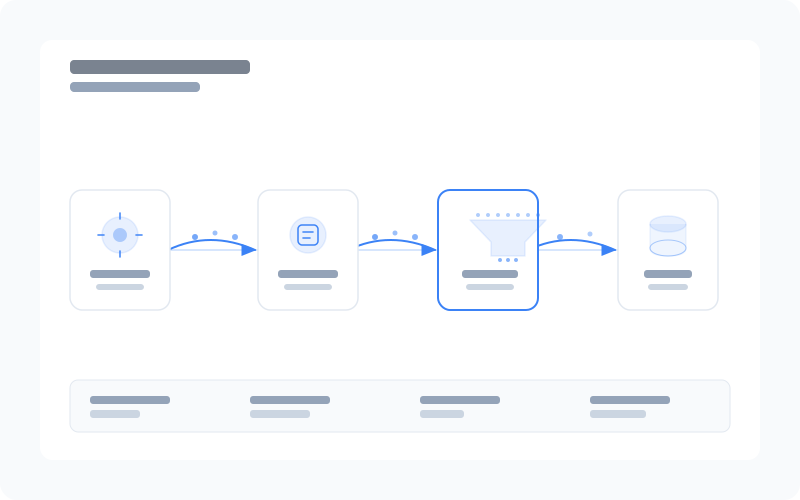
Osuite Ingestion Pipeline
- Tail-based sampling to make capture decisions after a trace completes — keeping errors and outliers, dropping the noise
- Sampling rules are configured for your account by the Osuite team — no collector wrestling on your side
- Reduce ingestion costs without losing visibility into what actually matters