Real User Monitoring

See exactly what your users see. Every click, every error, every slow request — stitched into the same trace as your backend, so you stop guessing where the problem actually is.

Get started
Real User Monitoring

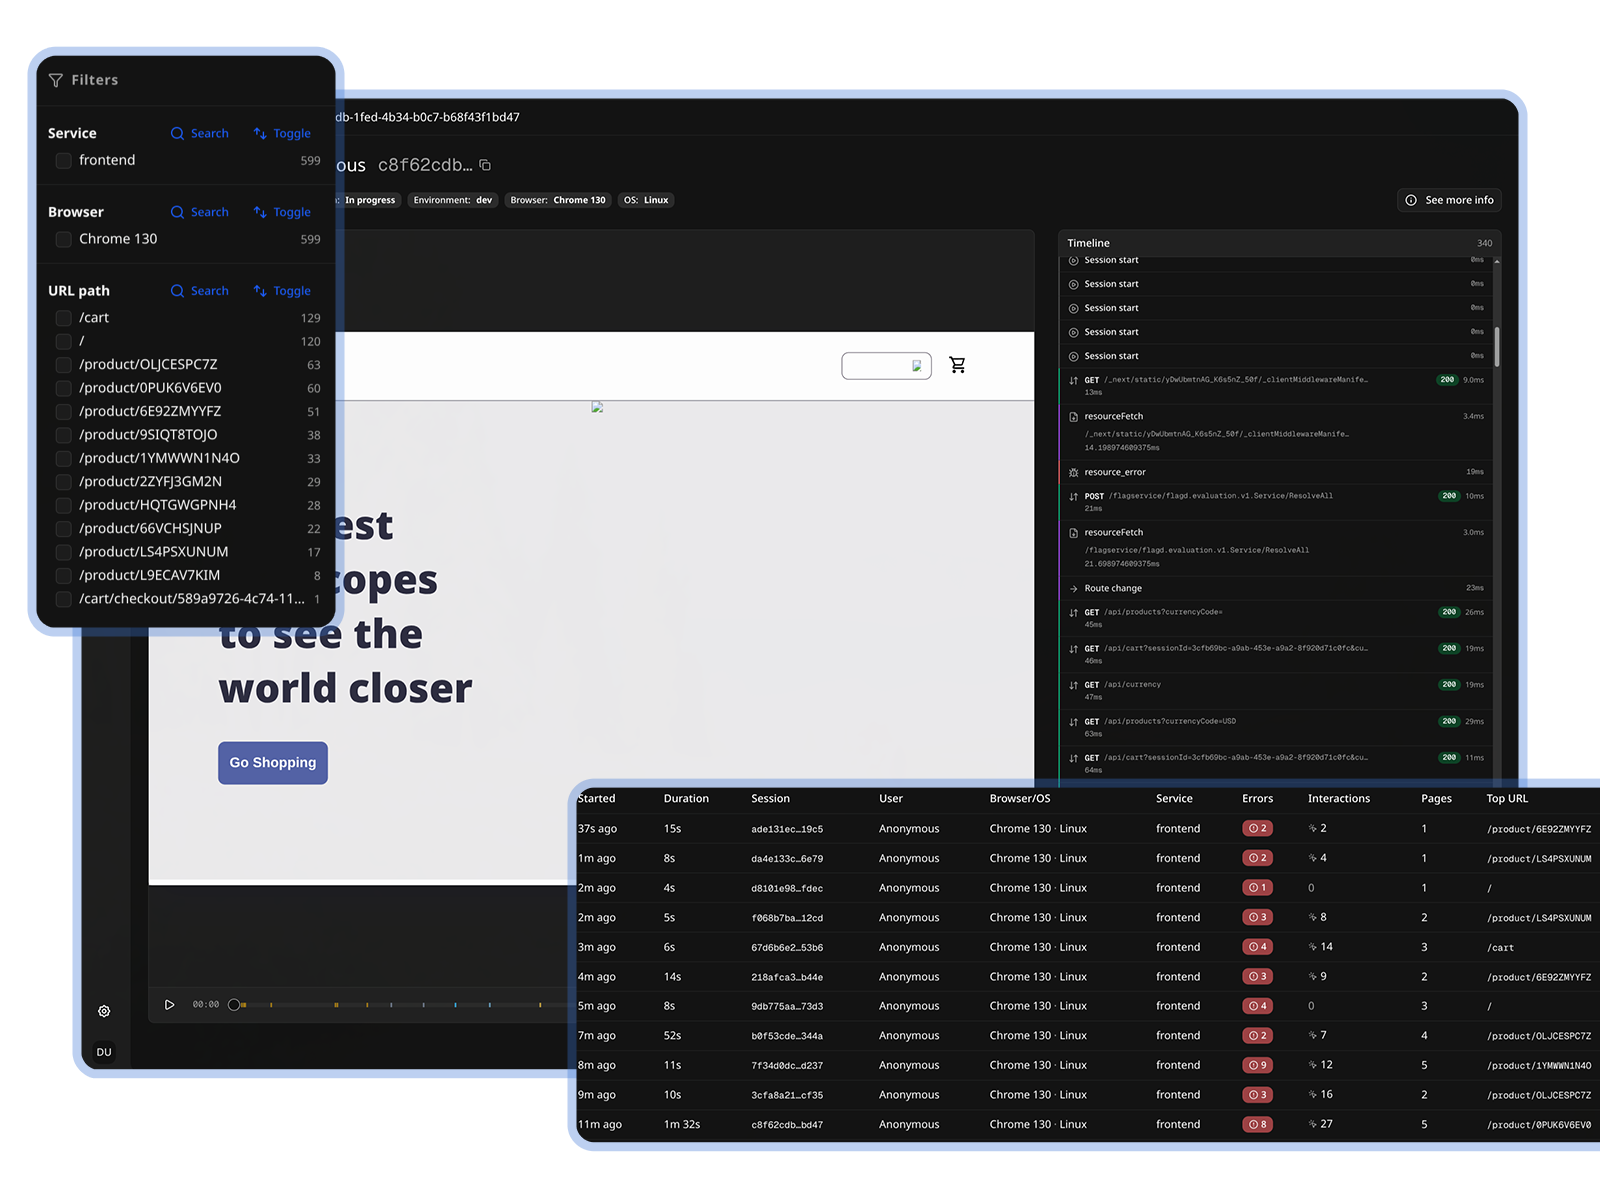
Frontend observability that speaks the same language as the rest of your stack.

One trace, frontend to database

Every browser fetch carries W3C traceparent and baggage, so a user's click stitches into the same trace as your backend services

Replay every session

rrweb-powered session replay with strict masking by default, lazy-loaded so the baseline SDK stays under 15KB gzip

Privacy-first, by default

Text and inputs are masked unless you opt in per element. Trace headers stay same-origin so you never leak context to third parties

End-to-End Trace Correlation

End-to-End Trace Correlation

  • Every browser fetch and XHR carries W3C traceparent and baggage headers, so the same request shows up in your backend's traces — not in a separate frontend silo
  • Jump from a user's click to the slow database query that backed it in a single waterfall, with frontend and backend spans living in the same view
  • session.id and user.id propagate to backend logs and traces, so any backend error is one click away from the exact session that produced it
Session Replay With Privacy By Default

Session Replay With Privacy By Default

  • rrweb-powered replay captures the DOM, every interaction, scroll, and route change so you can watch what the user actually did, not just what they reported
  • Strict masking is on out of the box — text and inputs are redacted unless you explicitly unmask them per element, and whole regions can be blocked from replay entirely
  • The replay engine is lazy-loaded via dynamic import, so the baseline SDK stays under 15KB gzip and the cost only lands when replay actually starts
Frontend Errors and Crashes

Frontend Errors and Crashes

  • Capture every uncaught error, unhandled promise rejection, failed resource load, and React render crash with full stack traces and component context
  • Error-triggered sampling upgrade: even sessions you chose not to sample get exported the moment something breaks, with the surrounding context intact
  • Group errors by frequency, browser, route, and user impact — and from any error, jump straight into the session replay or the matching backend trace
Real User Performance, Not Synthetic Averages

Real User Performance, Not Synthetic Averages

  • Track Core Web Vitals — LCP, INP, CLS, FCP — on every real session, segmented by route, browser, country, and release
  • SPA route-change spans automatically adopt the fetch and XHR calls that fire during navigation, so you see the true settling time of every page transition
  • Surface UX friction with optional rage-click, dead-click, and scroll-depth detection — so you find the moments users get stuck without waiting for a support ticket

Frequently Asked Questions

Osuite RUM is OpenTelemetry-native end to end. Frontend traces, errors, and replay all share the same session and trace context as your backend services, so a slow click links directly to the slow database query that caused it — in one waterfall, not two tools. You also get session replay, error monitoring, and frontend tracing in a single SDK instead of stitching three vendors together.
Replay masking is on by default — every text node renders as ***, every input is masked, and you opt back in per element with an osuite-unmask class. Whole regions like payment forms can be replaced with a placeholder using osuite-block, or excluded entirely with osuite-ignore. Trace headers (which carry session.id and user.id) are restricted to same-origin requests by default so they never leak to third-party APIs, analytics, or ad pixels. The session JWT used for replay uploads is held in memory only — never persisted to localStorage.
The baseline SDK is under 15KB gzipped. The rrweb replay engine and pako compressor are loaded via dynamic import — about 40KB gzipped — only when replay actually starts, so users on unsampled sessions never download them. Spans, logs, and replay chunks are all batched and sent off the critical path.
One init() call gives you page loads, fetch and XHR spans, SPA route changes (Next.js and any History API framework), click spans, uncaught errors, unhandled promise rejections, resource load failures, React render errors via the optional error boundary, and full session replay. Identity is opt-in via setUser, and richer interaction signals like rage clicks, dead clicks, and scroll depth are one config flag away.
Yes. Head-based session sampling decides once per session whether to export. Unsampled sessions still buffer recent activity, and the moment an error fires, the session is upgraded to sampled and the buffered context is flushed. So you keep the spend predictable without losing the sessions that actually matter.
Modern evergreen browsers — Chrome, Edge, Firefox, Safari — on an ES2020 target. Route-change tracking auto-detects Next.js and falls back to a generic History API adapter that works with React Router, Vue Router, SvelteKit, and anything else built on the History API. A subpath import provides an OsuiteErrorBoundary for React apps that want a render-error boundary.

See what Osuite can do for your team

Get a personalized walkthrough of the platform and a cost comparison against your current observability stack.

No commitment. No sales pressure. Just a real look at the platform.