Infrastructure Monitoring for Modern Stacks
Real-time visibility into your hosts, Kubernetes clusters, and any OTel-compatible infrastructure — with pre-built dashboards ready from day one.
Get started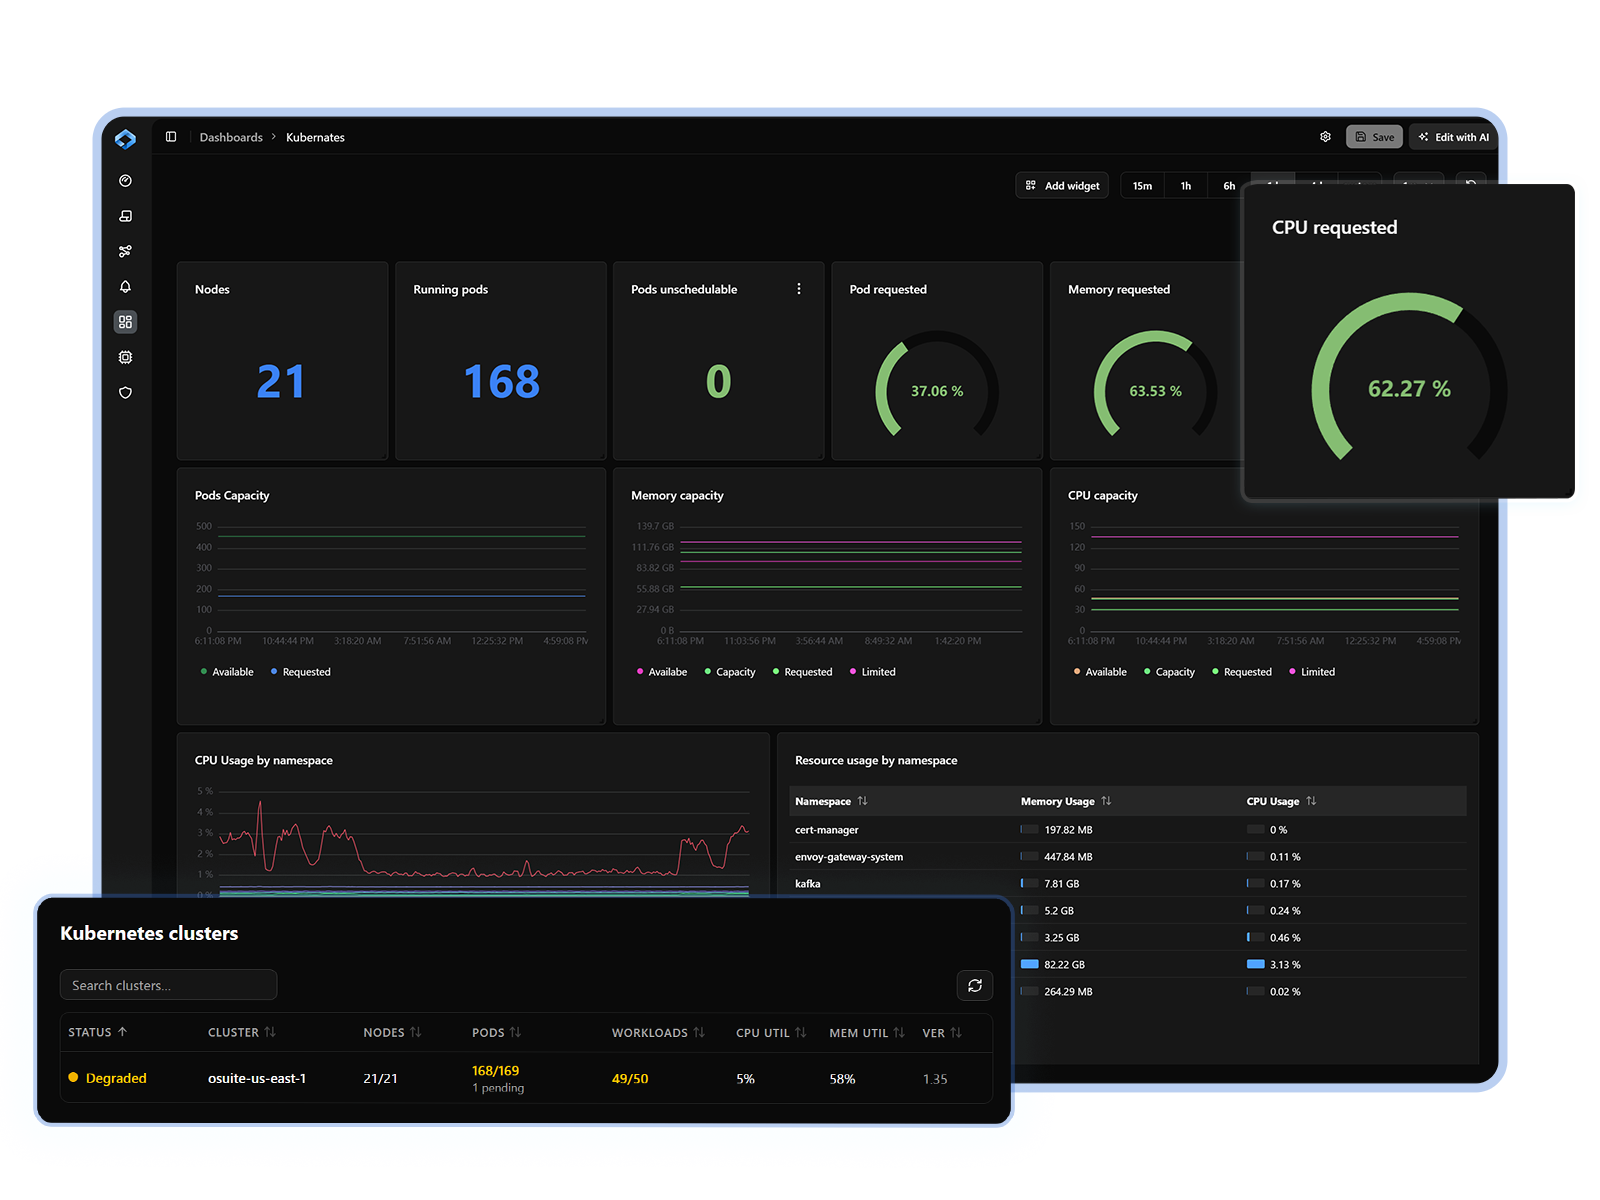
Know the health of your infrastructure before your users do.
Instant visibility
Pre-built dashboards for Hosts and Kubernetes clusters, live the moment you connect
Any infrastructure, any metric
OpenTelemetry native, so you can ingest and visualize metrics from any part of your stack
Correlated with your applications
Link infra health directly to APM, logs, and traces to find the true source of issues

Host Monitoring
- Monitor CPU, memory, disk, and network utilization across all your hosts in real time
- Pre-built host dashboards with the most critical metrics ready out of the box
- Set alerts on resource thresholds before utilization becomes an incident

Kubernetes Monitoring
- Full visibility into cluster health, node performance, pod status, and resource usage
- Pre-built Kubernetes dashboards covering the metrics that matter most to platform teams
- Monitor across namespaces, deployments, and nodes from a single unified view

Ingest Any Infrastructure Metric
- OpenTelemetry native — collect metrics from any cloud service, database, queue, or custom source
- Extend pre-built dashboards or build entirely new ones with the Custom Dashboard builder
- No proprietary agents or vendor-specific exporters required

Correlated Infrastructure and Application Health
- Link infrastructure metrics directly to APM data, traces, and logs in context
- Instantly answer whether a service issue is caused by the application or the underlying infrastructure
- Reduce war room time by giving every engineer a complete picture in one place