Escalation ladder for implementing self-hosted observability

Running a startup is like navigating a ship through stormy seas. You’re constantly adjusting sails, monitoring winds, and keeping an eye on the horizon. But what happens when the clouds roll in, and you can’t see the stars?
You need a compass. You need observability. As your startup grows and your systems become more distributed, the complexities multiply. Without proper visibility into your applications and infrastructure, you risk sailing blind—struggling to troubleshoot issues, maintain performance, and keep your customers happy. Early detection of problems is not just beneficial; it’s mission-critical for your success.
Why do it progressively
You might be wondering, “How do I implement observability without overwhelming my team?” The answer is simple: start small, slowly add pieces, and scale gradually. A progressive approach allows your team to iteratively build the system while keeping enough engineering resources for your product’s development. It reduces the risk of information overload and encourages a culture of iterative learning.
This article lays out the step-by-step escalation ladder to get to full stack observability while adding one piece at a time.
v1: Log Aggregation
The first step in your observability journey is setting up centralized log management.
Following is your architecture v1:
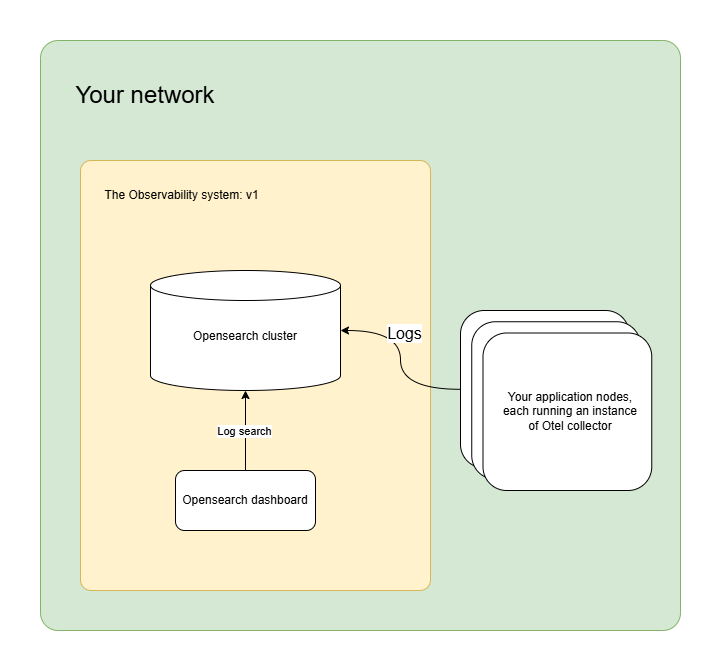
1.1 Setup OpenSearch
You’ll be using OpenSearch for centralized log management. We are choosing Opensearch because in later stages we’ll be using the same for storing traces as well.
1.2 Setup OpenTelemetry in agent mode
In stage 1 of the setup, you’ll be running open telemetry collectors in agent mode. This means you’ll not create an independent Otel collector cluster, instead, every node that runs your application will also run an Otel collector that will collect the logs and write them to your opensearch cluster.
Read this article for a bit more detail on how to wire these two pieces: Observability 101: Setting up log aggregation with OpenSearch and OpenTelemetry
v2: Monitoring and alerts
Once you’ve established log aggregation, it’s time to focus on system health monitoring.
The architecture of your system evolved to be as follows:
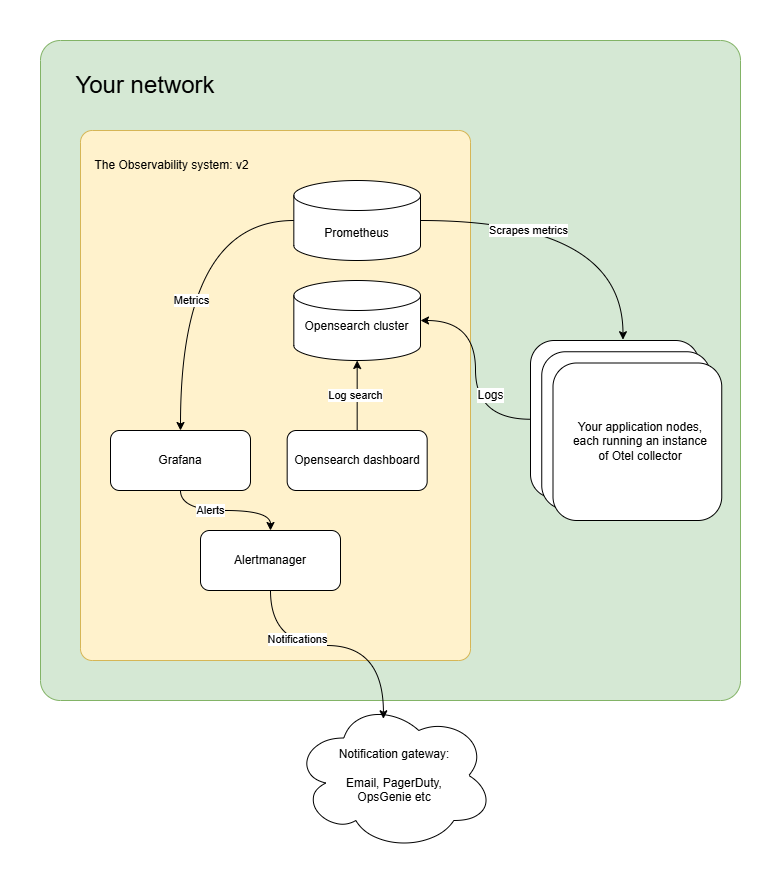
2.1 Prometheus
You will be using Prometheus for collecting metrics from different services and infrastructure. You’ll configure Prometheus to scrape data from your systems on defined intervals.
-
This is an example of how to configure Prometheus to scrape metrics.
-
Here is the reference for Prometheus config: Configuration | Prometheus
2.2 Grafana
You’ll be running Grafana to visualize the data Prometheus has collected. Moreover, you will be defining alerts in Grafana to be sent to Alert manager so that people can get notified if there is an anomaly.
Read this article to learn more about setting up Grafana and Prometheus: Setting up monitoring with Grafana and Prometheus in Kubernetes: A practical guide
2.3 Alert manager
You’ll be using Alertmanager to aggregate and route alerts. Sometimes when things fail, a lot of things fail at the same time. You don’t want your engineers to get bombarded with thousands of notifications when an outage happens. That’s where the Alertmanager will help you.
Here is the Alertmanager GitHub repo that details installation and configuration.
v3: Tracing
With logging and monitoring in place, it’s time to implement tracing. Jaeger serves as an excellent tool for distributed tracing, allowing you to gain deep visibility into service interactions. Read this article to learn how to set it up: How to set up tracing with Opentelemetry and Jaeger
With tracing added your system architecture will evolve to be the following: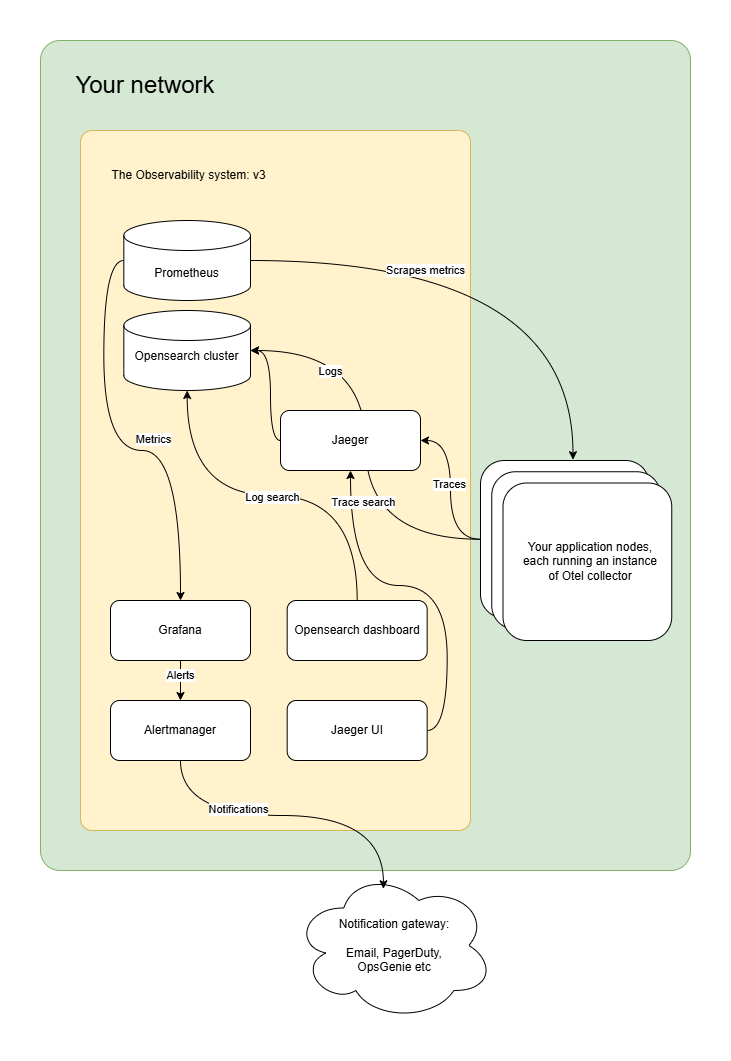
Scaling
With the v3 setup, you’ll have a good view into the bowls of your system. But as your startup grows, the load on your systems will raise and your observability system has to scale.
Following are a few suggestions about how to scale each component:
Opensearch
Once you start to ingest hundreds of gigabytes of logs and traces, you’ll have to scale the Opensearch cluster. Following are a few ways to optimize your Opensearch cluster.
- Reduce query time by reducing retention: If you reduce the retention period for your logs and traces, then you’ll need a smaller cluster. Minimize the retention to fit your needs.
- Scale by adding data nodes: See how much data your data nodes can handle (which will depend on the CPU and RAM of the data nodes) until the query time drops below acceptable limits for your need. When it drops below your acceptable limit, add data nodes.
- Scale by adding ingestion nodes: When you have a massive cluster ingesting terabytes of data every day, you don’t necessarily need to scale the data nodes. You can temporarily add ingestion nodes to handle the peak traffic and scale them down after the peak.
Opentelemetry
The v3 setup utilizes OpenTelemetry collectors as agents running on every application node. However, this configuration has a limitation: at some point, your OpenTelemetry collectors will consume a significant amount of resources on each node hosting your application. As a result, you may need to provision larger instances to accommodate this demand, which can impact your application’s performance due to competition for the same resources.
So you’d have to run an independent Opentelemetry collector cluster and scale it independently. Here is how to scale your Opentelemetry collector cluster:
- After setting up an independent cluster, you can define a Horizontal Auto Scaling schema of the cluster and put a load balancer in the front to handle peak traffic.
After that, your system architecture will look something as follows: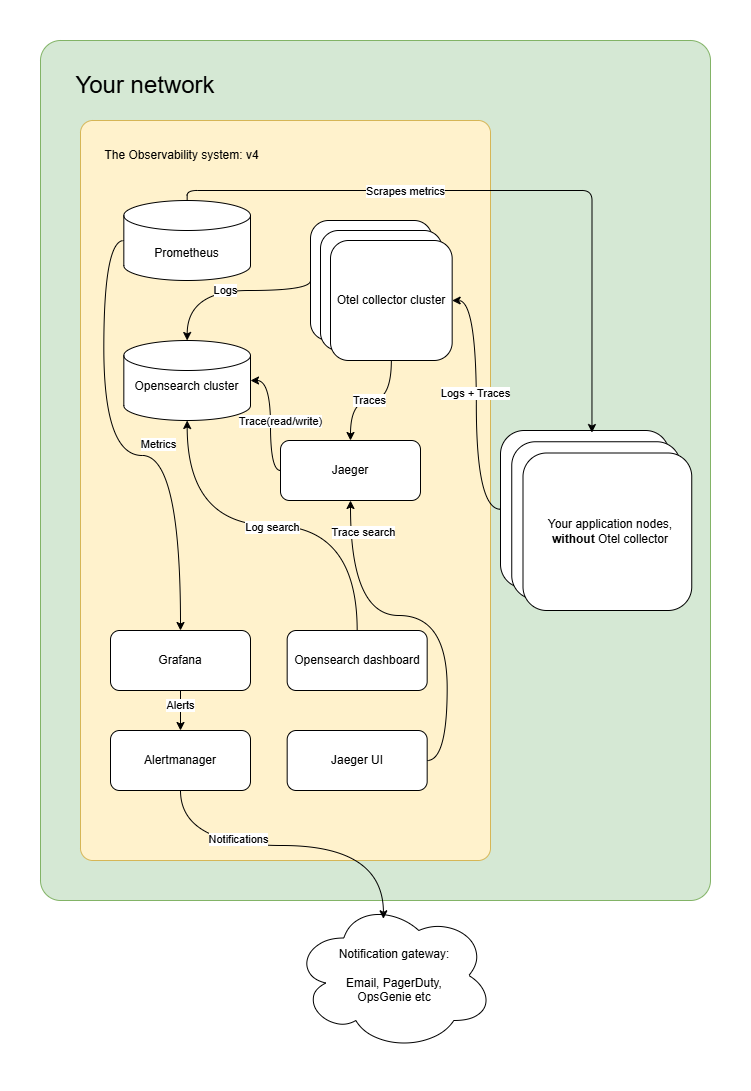
Potential pitfalls in implementing self-hosted observability
While implementing observability offers significant benefits, there are potential pitfalls to keep in mind:
- Maintenance overhead: There will be a maintenance overhead on your engineering team to maintain the system. Do the cost-benefit analysis before going all in. Start with v1 described here, and see how your team is handling it.
- Integration Complexity: Introducing multiple observability tools can create integration challenges. Start with a few essential tools and expand as your team becomes more comfortable. Use the escalation ladder discussed in this article.
- Data Overload: Collecting too much data can be counterproductive. Focus on monitoring key metrics that directly impact your business. Ask yourself what specific challenges you’re trying to solve with observability.
- Training and Adoption: Ensure your team receives effective training to leverage observability tools. Encourage them to interpret the data accurately and make informed decisions. Cultivate a culture of monitoring the system closely after a major release.
- Performance impact: It’s important to be aware of the performance implications when using the OpenTelemetry SDK. While the performance overhead is minimal, it can still affect your application’s efficiency. If your application is highly performance-sensitive, this is a factor worth considering.
Conclusion
Implementing observability in your startup is not just a technical necessity; it’s a strategic advantage that can significantly enhance your operational capabilities. By taking a progressive approach—starting with log aggregation, moving to monitoring, and finally implementing tracing and scaling slowly as you go — you can build a robust observability framework tailored to your evolving needs.
Let’s get monitoring!