How to set up tracing with Opentelemetry and Jaeger

This is the second installment of a multi-part series talking about how to set up basic observability at your startup.
Why your startup needs this
As your startup scales, the interactions between services become increasingly intricate. With each new service, the potential for performance issues grows, and without basic observability, these issues can remain hidden until they impact your users.
Consider this, your startup launched a highly anticipated feature only to face unexpected downtime shortly after. Your CTO reflected, “We thought we were ready, but our inability to monitor how our services communicated resulted in a chaotic situation. Our downtime didn’t just cost us money; it cost us customer trust.”
Another example: Your app experiences significant latency during peak traffic hours due to an unoptimized piece of code. You realized too late that your monitoring tools aren’t capturing the necessary data to identify the bottlenecks. Making it an absolute nightmare to debug, countless engineering hours wasted, and brand value degraded.
These aren’t hypothetical situations. These are way too common in startups. Once you lose trust early building it back is harder the second time around. We have observed these cautionary tales play out countless times, indicating that investing in observability is not just a technical choice but a strategic imperative.
Why you need tracing
Distributed tracing involves recording the paths taken by requests as they propagate through a system. When your system processes a request, tracing allows you to see how different services interacted with each other to complete the request.
Following is how that helps you:
Identifying performance bottlenecks
Imagine your application experiences latency spikes during high-traffic periods. With Jaeger, you can visualize the entire request path and identify exactly where the delays are occurring. For instance, if a specific API endpoint slows down, tracing can help you determine whether the issue originates from a slow database query or a problematic third-party service. This clarity enables you to implement targeted optimizations to enhance performance.
Troubleshooting common issues
Tracing can assist in troubleshooting a lot of common issues, such as latency spikes and service failures. If a payment processing service times out, you can trace the request flow to see if the bottleneck lies within that service or in an upstream dependency. This insight allows your team to quickly diagnose and rectify issues, improving reliability across your microservices.
Enhancing User Experience
By providing deeper insights into user behavior and system interactions, tracing can significantly enhance the user experience. Analyzing trace data allows you to understand common user paths and identify areas that may lead to drop-offs. For example, if users consistently abandon their shopping carts during checkout, tracing can help you identify where the process is failing and enable you to streamline that experience, ultimately leading to higher conversion rates and improved user satisfaction.
Now that you understand why you need it, let’s set it up.
The setup
We will set up the components in Kubernetes. You’ll need a opentelemetry collector that will receive the traces from all your services, which will then be written to Opensearch, which will then be queried by Jaeger.
Note: Setting up Opensearch is beyond the scope of this article, we are assuming that you have a running opensearch cluster.
Why Jaeger
Distributed Context Propagation
Distributed context propagation is vital for tracking requests across multiple services. It allows you to maintain a consistent context as requests flow through your architecture, making it easier to spot where delays occur. This is crucial for diagnosing performance issues efficiently and ensuring that your users have a seamless experience.
Adaptive Sampling
Adaptive sampling is a feature that allows you to control the volume of traces collected based on your system’s performance. Instead of capturing every trace—which could overwhelm your resources—adaptive sampling ensures that you gather just enough data to make informed decisions without taxing your system. This is particularly beneficial for startups that need to manage resources carefully while still gaining valuable insights.
Setup Jaeger
Jaeger will be the tool you’ll be using to analyze the traces. In this tutorial, we will be installing Jaeger in Kubernetes.
Step 1: Install the Jaeger operator, Note that the operator has to run on the same namespace as your Jaeger instance will run
kubectl create namespace observability;kubectl apply -n observability -f https://github.com/jaegertracing/jaeger-operator/releases/download/v1.57.0/jaeger-operator.yamlStep 2: Create a Jaeger instance with the following manifest.
apiVersion: jaegertracing.io/v1kind: Jaegermetadata:  name: jaeger  namespace: observabilityspec:  strategy: production  collector:    maxReplicas: 4  ui:    options:      dependencies:        menuEnabled: false      menu:        - label: "About Jaeger"          items:            - label: "Documentation"              url: "https://www.jaegertracing.io/docs/latest"  storage:    type: elasticsearch    secretName: jaeger-es-credentials    options:      es:        server-urls: https://<your-opensearch-url>:9200        index-prefix: jaeger        tls:          enabled: true          ca: /tls/ca.crt    esIndexCleaner:      enabled: true      numberOfDays: 7      schedule: "55 23 * * *"
  volumeMounts:    - name: ca-cert      mountPath: /tls/ca.crt      subPath: ca.crt  volumes:    - name: ca-cert      secret:        secretName: ca-secret        items:          - key: ca.crt            path: ca.crt
Notes:
- You have to create a secret
jaeger-es-credentialsthat containsES_USERNAMEandES_PASSWORD - You have to create a secret named
ca-certthat contains the ca certificate that issued the tls certificate to your opensearch cluster - Read the jaeger operator API docs if you want to customize this further: https://github.com/jaegertracing/jaeger-operator/blob/main/docs/api.md
Setup Opentelemetry collector to send traces to jaeger
In the previous article, we installed the Otel collector. Now, we will modify the value file to also receive traces.
Step 1: Update the values.yaml
image:  repository: "otel/opentelemetry-collector-contrib"nameOverride: otelcolmode: deploymentpresets:  kubernetesAttributes:    enabled: trueresources:  limits:    memory: 500Miservice:  type: ClusterIPextraVolumes:  - name: ca-cert    secret:      secretName: <name-of-your-secret-that-contains-ca-cert>      items:        - key: ca.crt          path: ca.crtextraVolumeMounts:  - name: ca-cert    mountPath: /tls/ca.crt    subPath: ca.crtconfig:  extensions:    basicauth/os:      client_auth:        username: admin        password: admin-password  receivers:    otlp:      protocols:        http:          cors:            allowed_origins:              - "http://*"              - "https://*"  processors:    batch:
  exporters:    opensearch/logs:      logs_index: "logs-stream"      http:        endpoint: "https://<your-opensearch-endpoint>:9200"        auth:          authenticator: basicauth/os        tls:          insecure: false          ca_file: /tls/ca.crt    otlp/jaeger:      endpoint: "jaeger.observability.svc.cluster.local:4317"      tls:        insecure: true  service:    pipelines:      logs:        receivers: [otlp]        processors: [batch]        exporters: [opensearch/logs]      traces:        receivers: [otlp]        processors: [batch]        exporters: [otlp/jaeger]
Take a note of config.exporter.otlp/jaeger section. The endpoint needs to point to the Jaeger instance you created in the previous step. Also, notice the new pipeline named traces .
Now run the helm upgrade to have your collector receive traces
helm upgrade otel-col open-telemetry/opentelemetry-collector -f values.yamlStep 2: Instrumentation As mentioned in the previous article you can instrument your apps without any code with opentelemetry. Follow this guide to instrument your apps. https://opentelemetry.io/docs/zero-code/
Jaeger UI
Now we have traces flowing into Jaeger following are a few examples of what you can do with this data. Note that, this is not a deep dive into how to use Jaeger.
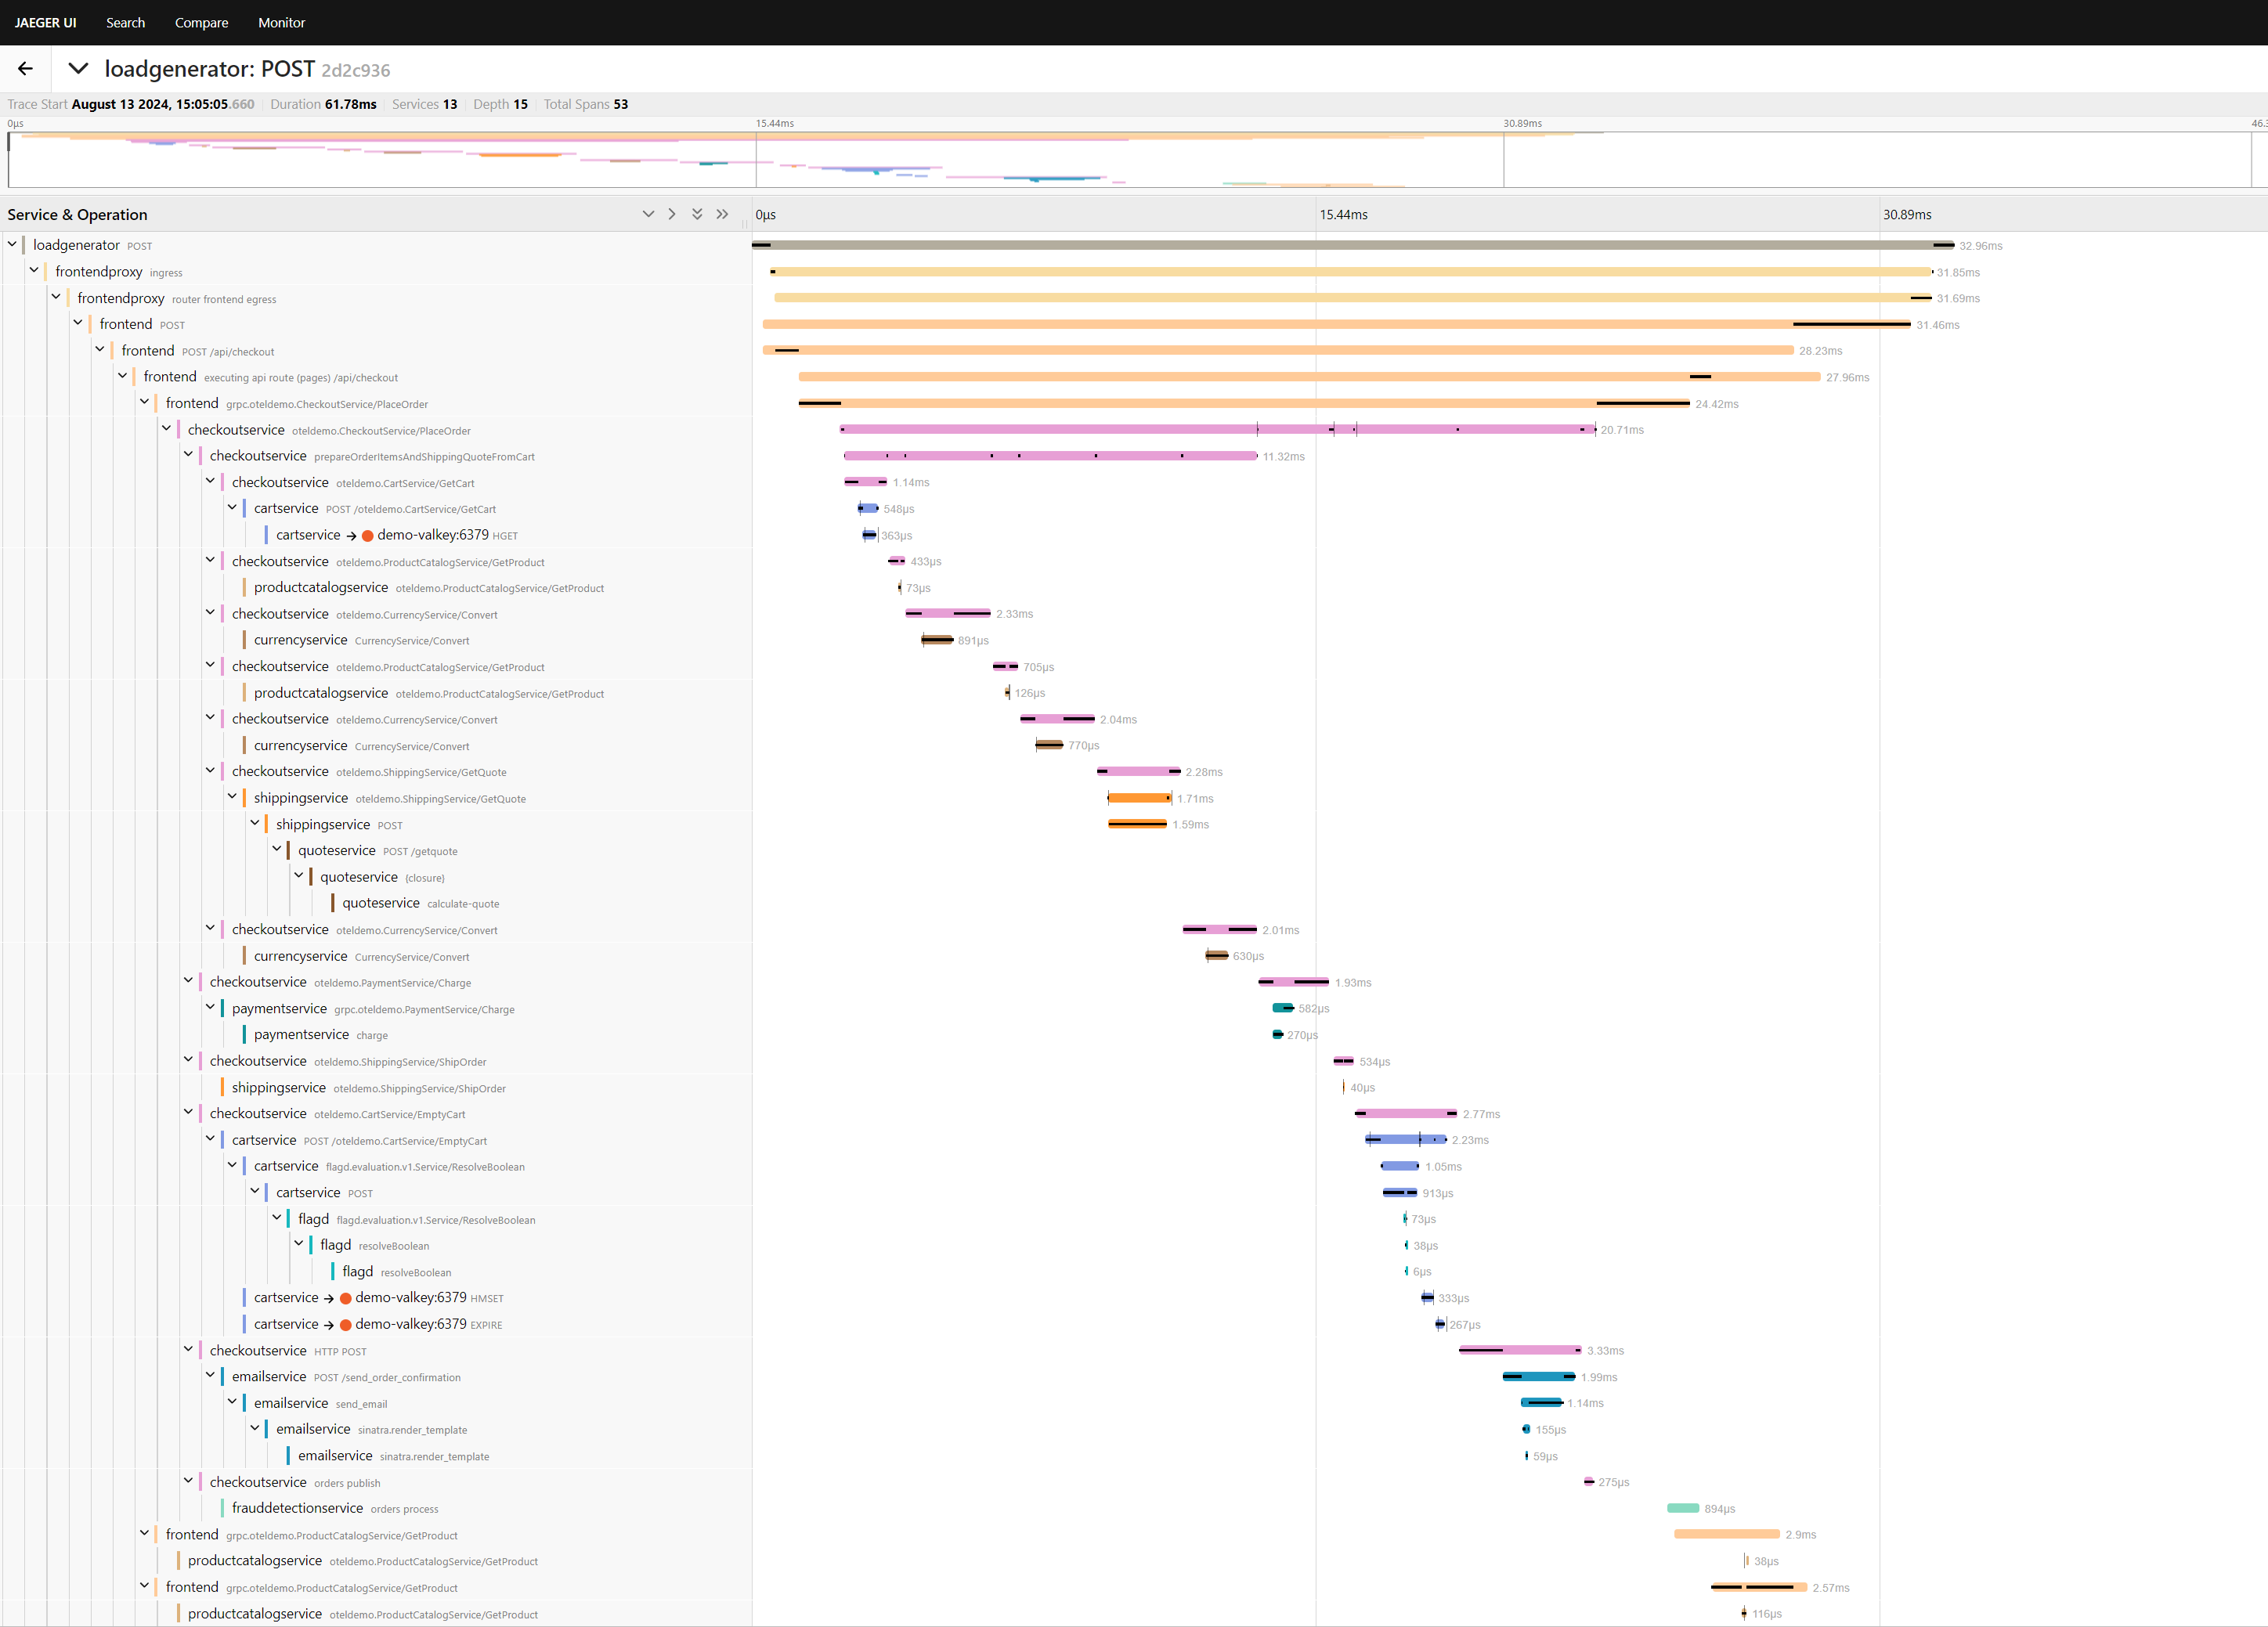
Trace timeline
In the Jaeger UI, you can see the timeline of a request. This also shows you how much time the request spent in each service, which will show you the bottlenecks in your system.
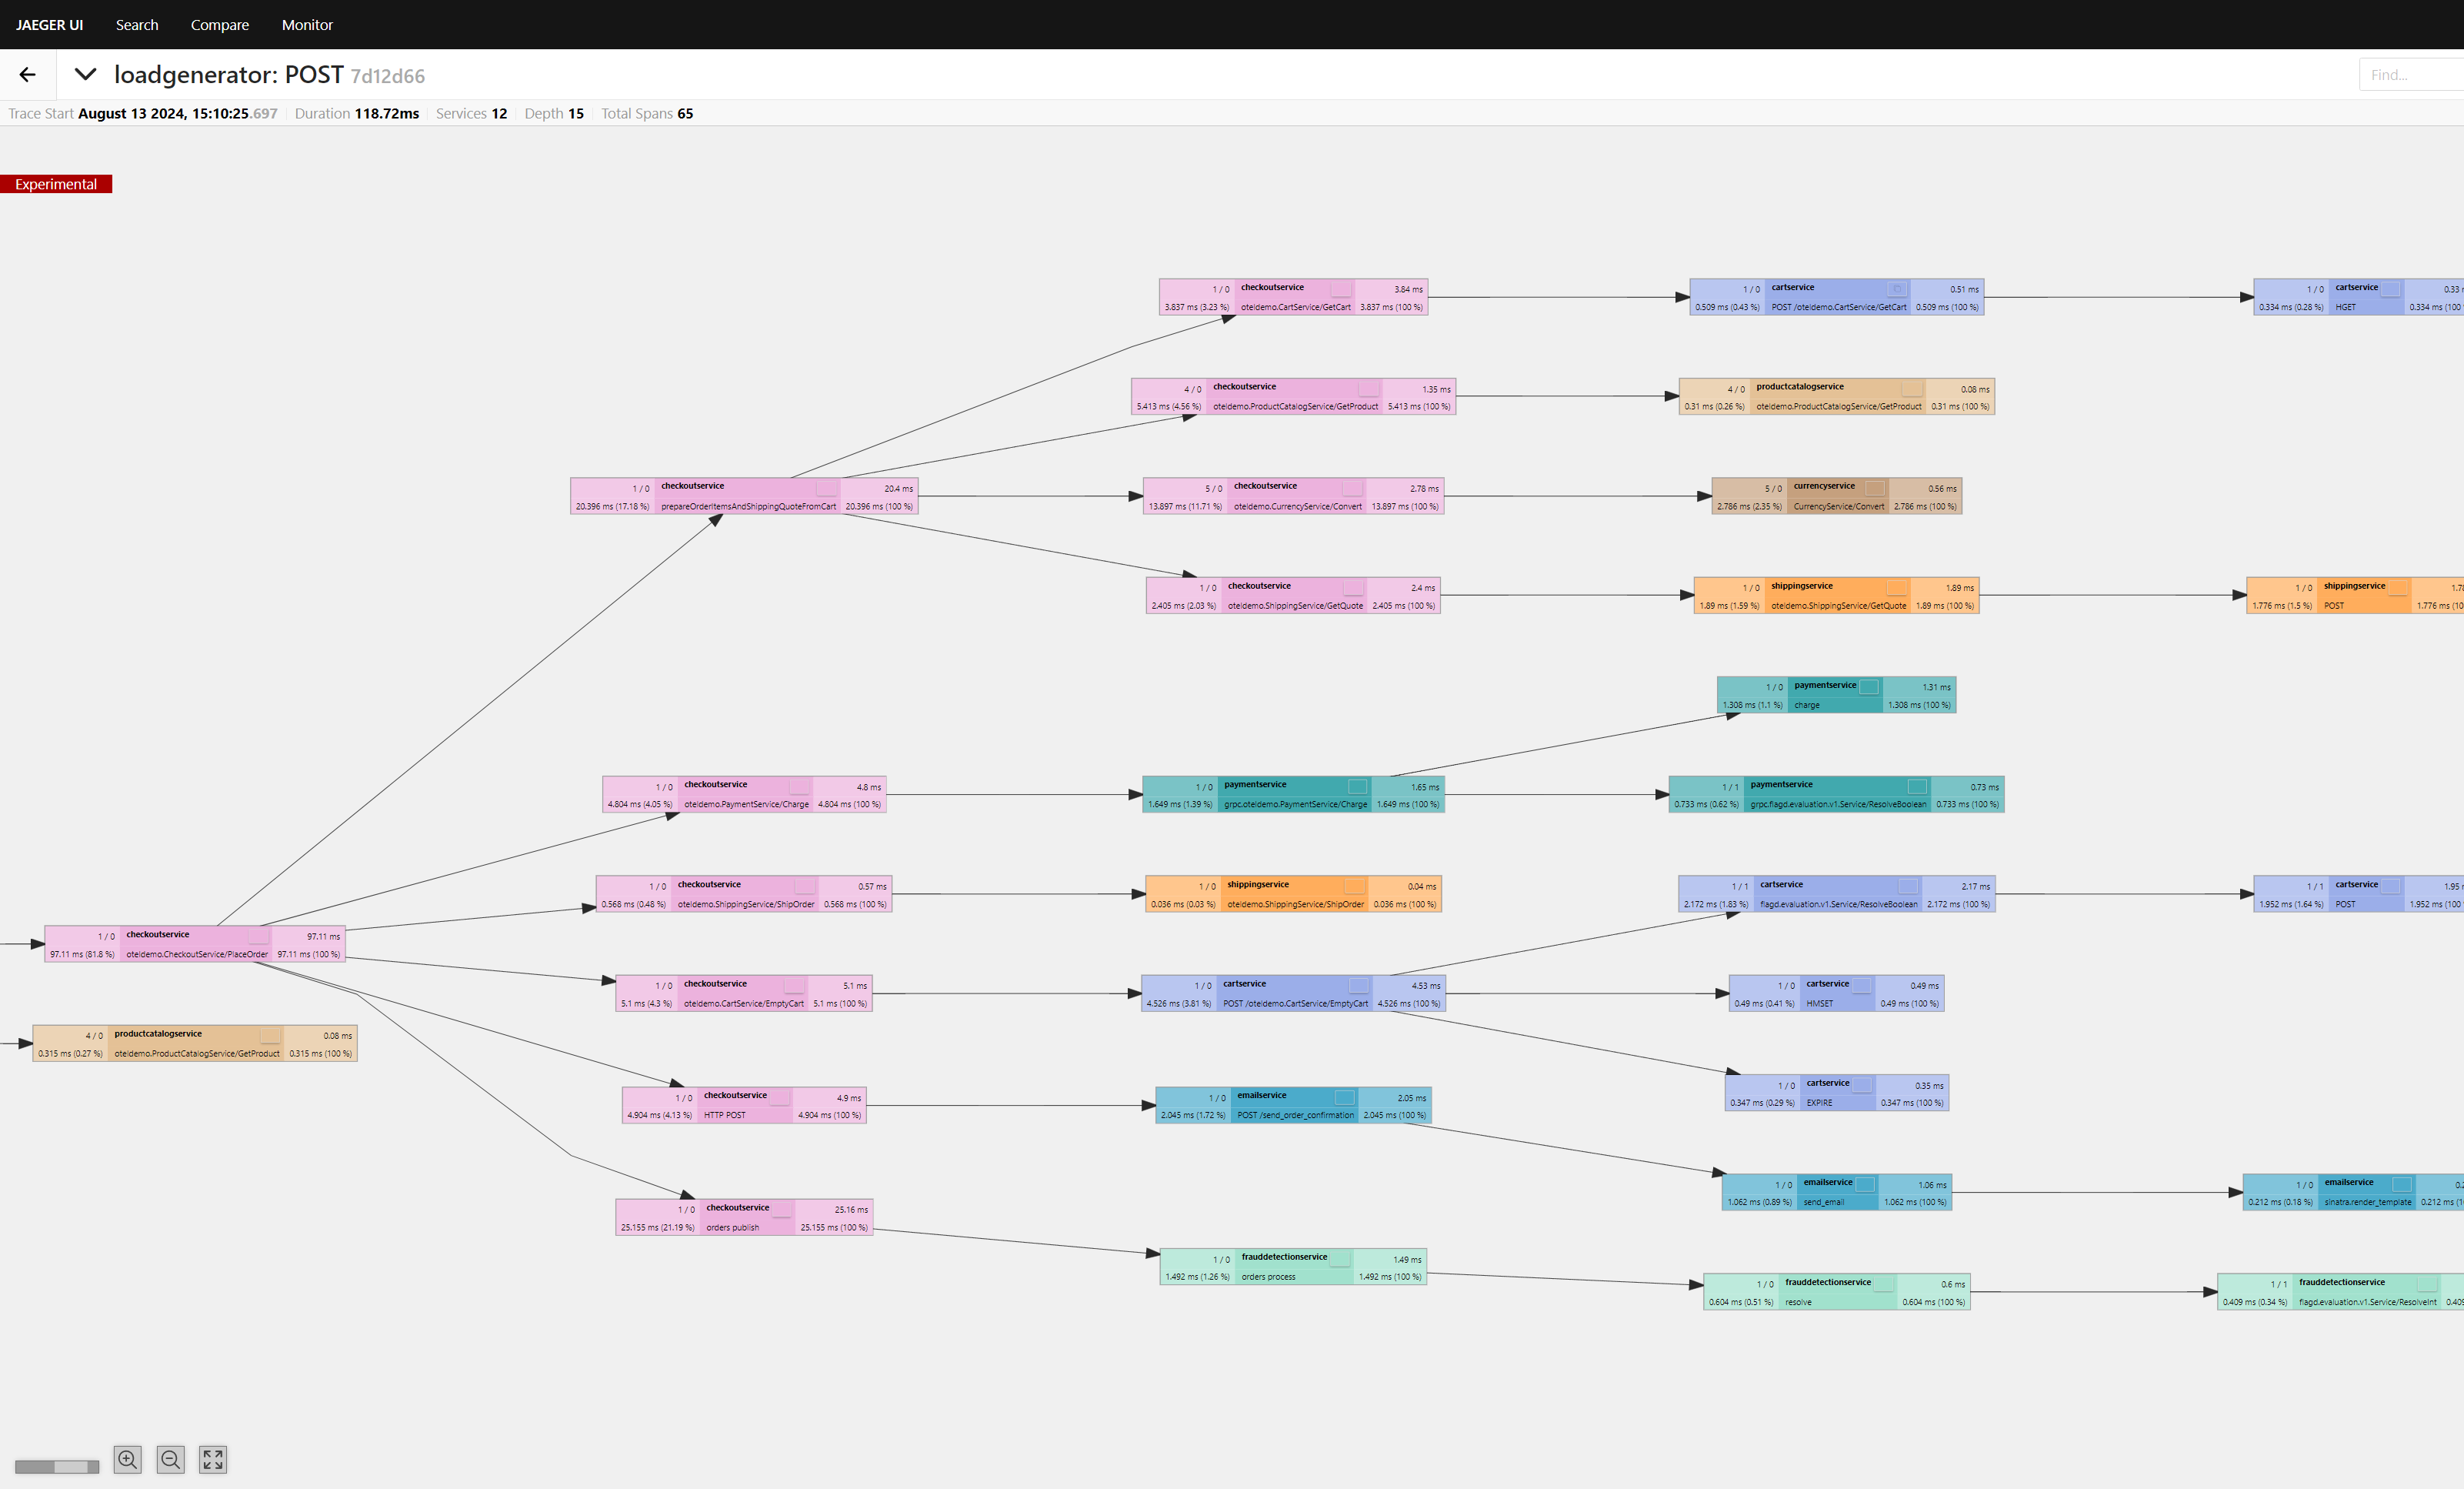
Dependency analysis
You can visualize the complete journey of a request through different services and components of an application. This allows you to visualize dependencies between systems.
Conclusion
Setting up tracing with OpenTelemetry and Jaeger is a strategic move that enhances your startup’s observability capabilities. By implementing robust observability practices, you can catch performance issues before they escalate, ensuring your systems remain reliable and efficient.
While there may be challenges during setup—such as integrating new tools or training your team—the long-term benefits far outweigh these hurdles. The insights gained from tracing will empower you to make data-driven decisions that lead to improved performance and a better user experience.
So, take that leap and invest in observability today. Your startup’s success hinges on your ability to monitor and optimize your microservices effectively. With OpenTelemetry and Jaeger, you’ll be well-prepared to navigate the complexities of your architecture, ensuring that your application delivers optimal performance and delightful user experiences. Don’t wait for issues to arise—act now and set your startup on the path to success!