Observability 101: Setting up log aggregation with OpenSearch and OpenTelemetry

Why your startup needs log aggregation
As your startup grows, the complexity of your distributed systems can become overwhelming. You’re likely managing a multitude of microservices, each responsible for different components of your application. This increased complexity brings with it a critical need for real-time log monitoring. Picture this: you launch a new product feature that everyone has been excited about, only to discover, after the fact, that untracked errors caused significant issues. The fallout is immediate—team morale plummets as late-night debugging sessions become the norm, customer trust erodes, and your revenue takes a hit when frustrated users abandon your platform.
This scenario may sound all too familiar, and it’s not uncommon in the fast-paced world of startups. Fortunately, there’s a silver lining: many organizations are now adopting observability tools to improve incident response times and operational efficiency.
Aggregating and centralizing your logs in one place is the critical first step toward having a 360-degree view of your system.
In this article you’ll learn how to centralize your logs using OpenSearch and OpenTelemetry, helping you catch issues before they escalate into crises.
The setup
Why OpenSearch?
You might be asking yourself, why should your startup invest in OpenSearch? It’s simple: Unlike its parent, i.e: ElasticSearch, OpenSearch is a truly free, open-source search engine that is built to scale making it an ideal choice for startups looking to implement a cost-effective solution.
Why OpenTelemetry
OpenTelemetry is a game changer observability. It provides a standardized method for collecting telemetry data—logs, metrics, and traces—allowing you to gain deeper insights into your application’s performance and behavior. By integrating OpenTelemetry, you can better understand how your services interact and where potential bottlenecks might arise.
Even though this article just focuses on logs, with Opentelemetry in place you are equipped to also integrate metrics and traces as easily.
Moreover, One of the standout features of OpenTelemetry is its auto-instrumentation capability. This means you can automatically collect telemetry data without making extensive changes to your existing code. This reduces adoption friction significantly.
With that said, let’s setup the system:
How to use OpenSearch
Setup
How to setup a opensearch cluster is beyond the scope of this article. I am assuming you have a Opensearch cluster ready to be used.
In this article we will talk about how to set it up as a central log search engine.
Setup Data stream
Datastream in Opensearch is an collection of underlying indices under one name. This will allow us to configure Opentelemetry to send logs to the data stream and have it stored in different indices, using one index per day. This setup also makes it easy to configure retention.
In this example we will be creating a data stream named logs-stream
First, create the underlying index pattern for the data stream
curl -X PUT "https://<opensearch_url>/_index_template/logs-stream-template" \
    -H 'Content-Type: application/json' \
    -d '{ "index_patterns": "logs-stream", "data_stream": {}, "priority": 100 }' \
    --user <username>:<password>
Create the data stream
curl -X PUT "https://<opensearch_url>/_data_stream/logs-stream" \
    --user <username>:<password>
Setup rollover
You will want the data stream to use a new underlying index for each day. You can do that by rolling over the data stream every night.
Schedule the following command to run every midnight using cron
curl -X POST "https://your-opensearch-url/logs-steam/_rollover" \
    -u <username>:<password>
Setup retention
I have written the following python script to manage data stream, which you can use for free. Clone this repo https://github.com/malayh/opensearch-healpers and schedule the following command to run every night.
python ./opensearch-helpers/data_stream.py clean \
    --url https://<your-opensearch-url> \
    --username <username> \
    --password <password> \
    --data-stream logs-stream \
    --retention-period 7
Running the above script every night will keep 7 days worth of logs. Adjust the retention period according to your needs.
Now that we have Opensearch ready to accept logs, let’s configure opentelemetry to send logs to it.
How to setup OpenTelemetry
Setup
You need an open telemetry collector that will collect logs from your containers and send them to opensearch. In this article, we will setup open telemetry on a Kubernetes cluster using Helm.
We are using the open telemetry helm chart
helm repo add open-telemetry https://open-telemetry.github.io/opentelemetry-helm-chartsEdit the following values.yaml files according to your need.
image:
  repository: "otel/opentelemetry-collector-contrib"
nameOverride: otelcol
mode: deployment
presets:
  kubernetesAttributes:
    enabled: true
resources:
  limits:
    memory: 500Mi
service:
  type: ClusterIP
extraVolumes:
  - name: ca-cert
    secret:
      secretName: <name-of-your-secret-that-contains-ca-cert>
      items:
        - key: ca.crt
          path: ca.crt
extraVolumeMounts:
  - name: ca-cert
    mountPath: /tls/ca.crt
    subPath: ca.crt
config:
  extensions:
    basicauth/os:
      client_auth:
        username: admin
        password: admin-password
  receivers:
    otlp:
      protocols:
        http:
          cors:
            allowed_origins:
              - "http://*"
              - "https://*"
  processors:
    batch:

  exporters:
    opensearch/logs:
      logs_index: "logs-stream"
      http:
        endpoint: "https://<your-opensearch-endpoint>:9200"
        auth:
          authenticator: basicauth/os
        tls:
          insecure: false
          ca_file: /tls/ca.crt
  service:
    pipelines:
      logs:
        receivers: [otlp]
        processors: [batch]
        exporters: [opensearch/logs]
The config.extention.basicauth/os defines auth for opensearch and config.exporters.opensearch/logs defines the connection to opensearch. Note that you have to create a secret that contain the ca certificate that is used to create opensearch’s tls certificate.
Now run to start open telemetry collectors
helm install otel-col open-telemetry/opentelemetry-collector -f values.yamlInstrumentation
As mentioned above you can instrument your apps without any code with opentelemetry. Follow this guide to instrument your apps. https://opentelemetry.io/docs/zero-code/
Now that you have the logs flowing to opensearch, let’s learn how to search them
How to search logs in opensearch
Create index pattern
Go to Management > Dashboards Management > Index patterns > Create index pattern Create an index pattern with the name “logs-stream*“
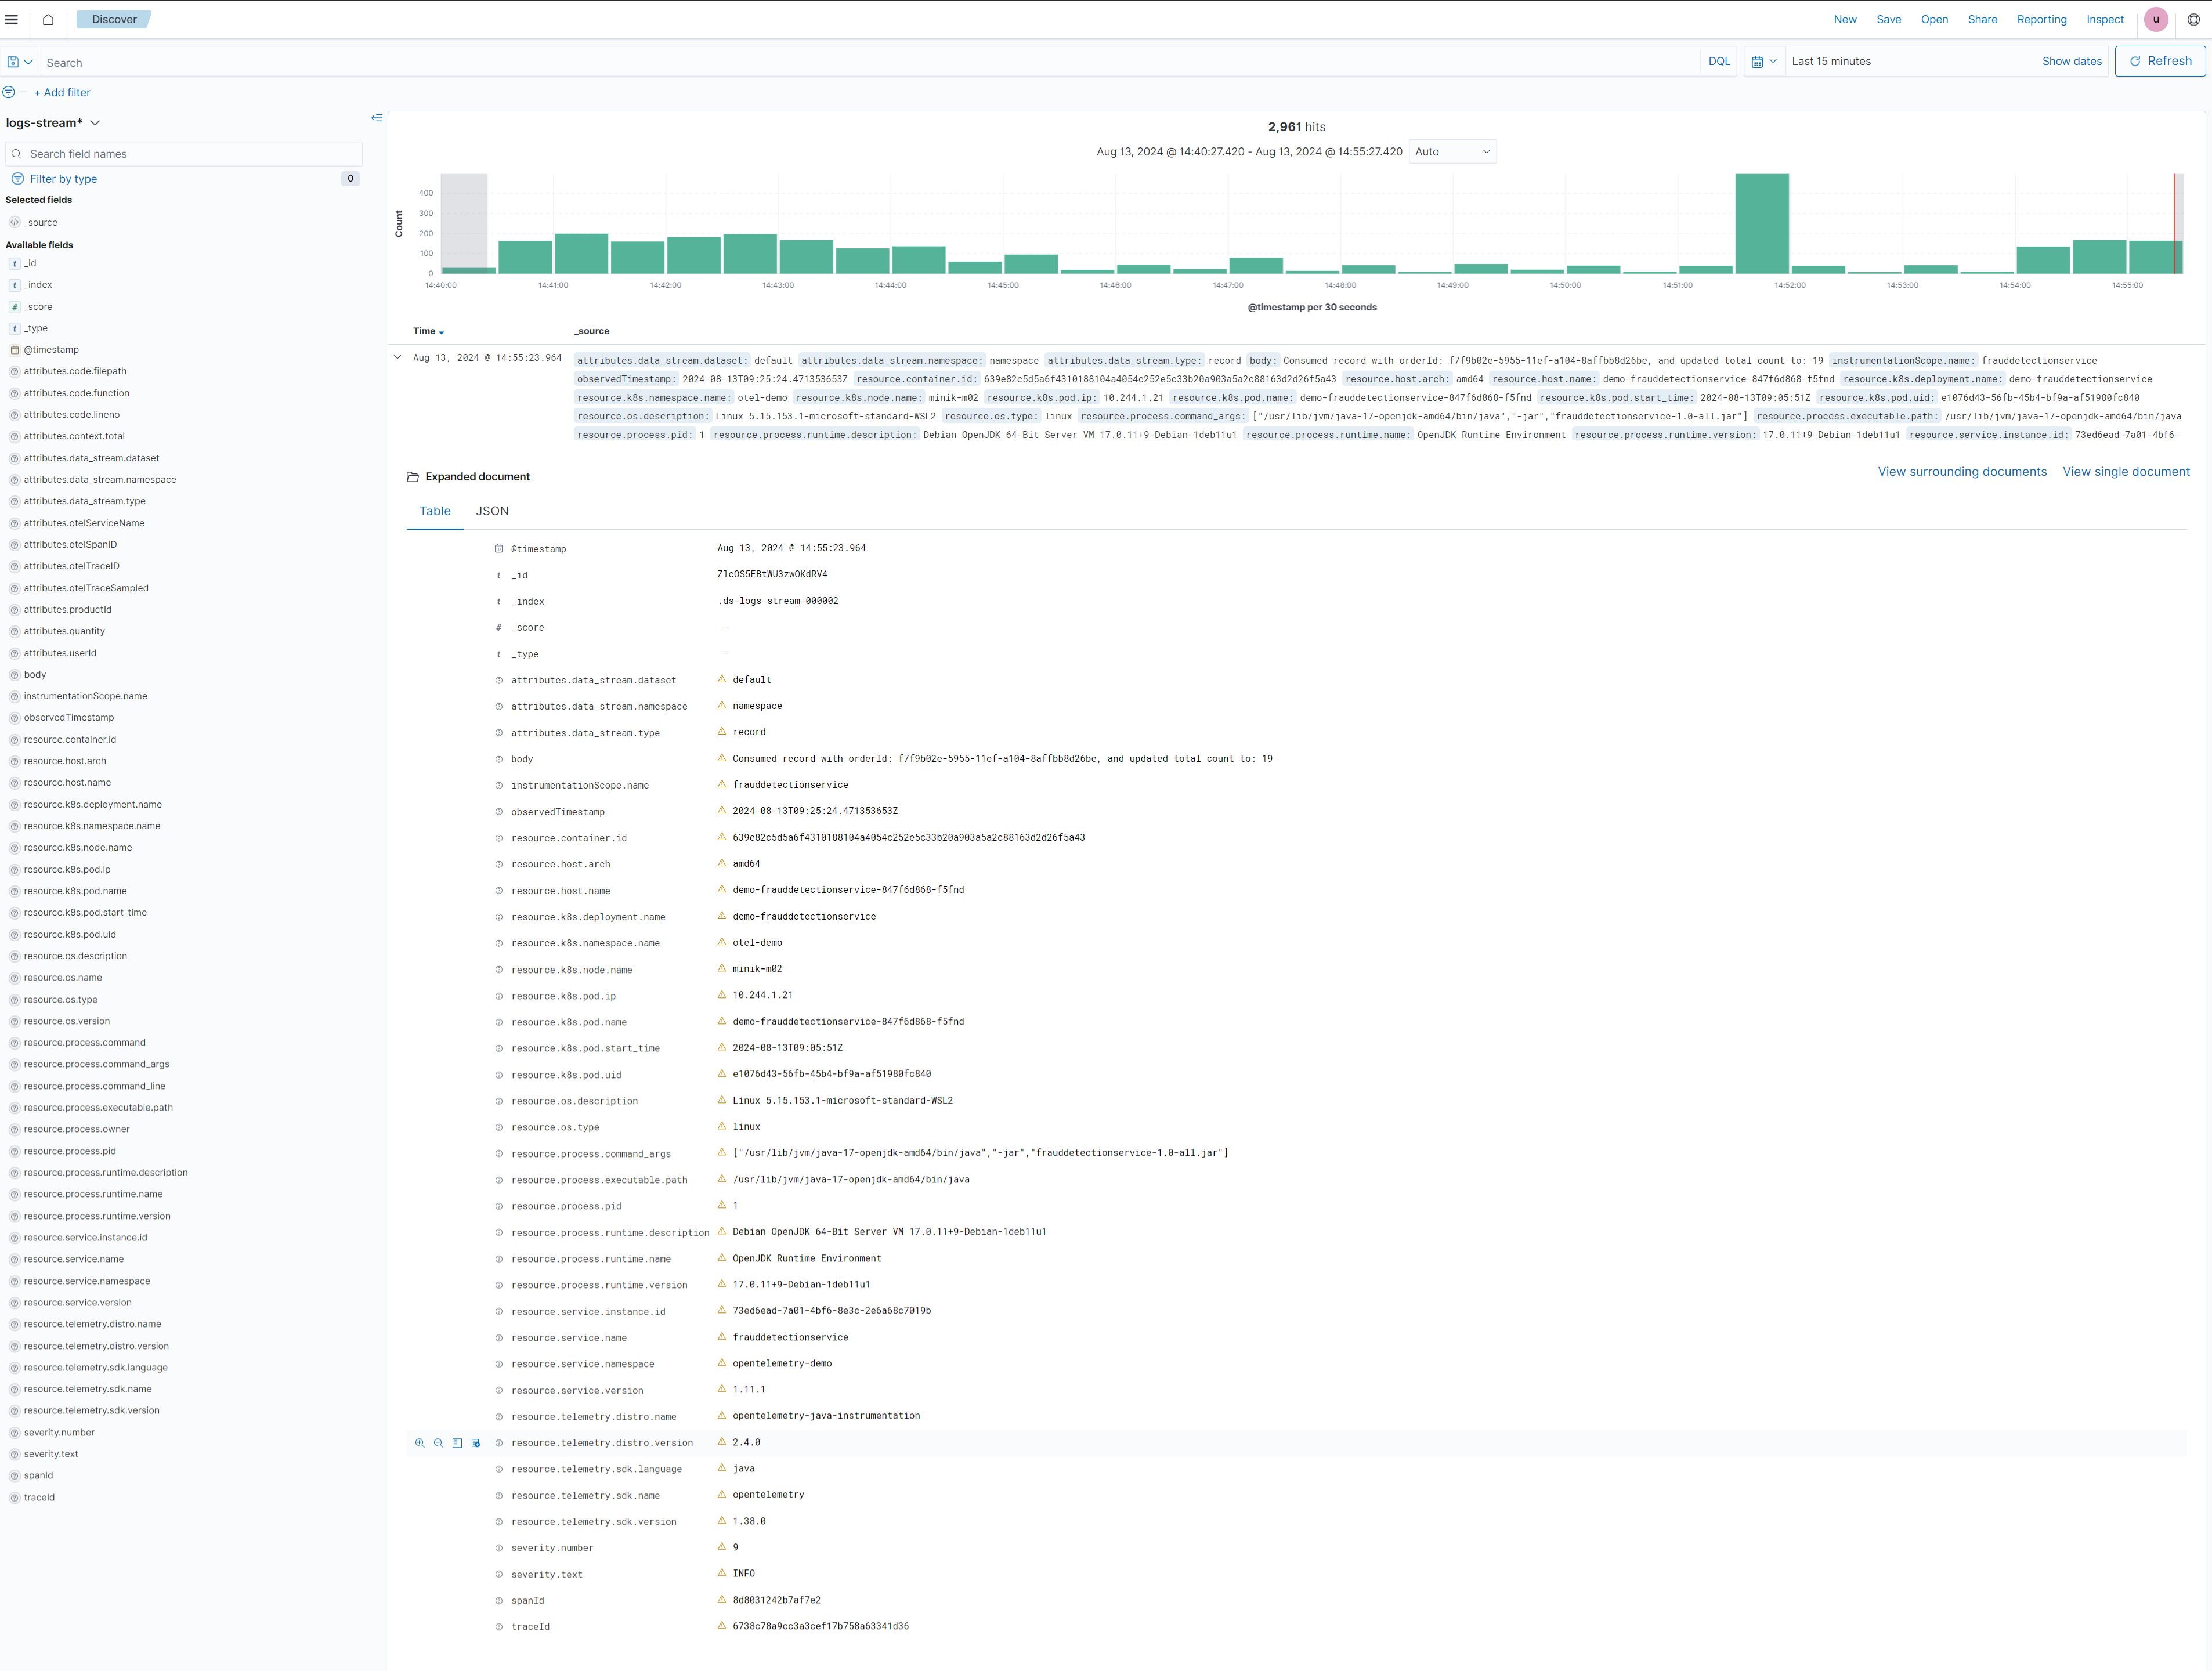
Search
Go to “Discover” on opensearch dashboard, and select your index pattern. Now you can search your logs, apply filters select time frame, etc.
Conclusion
In conclusion, implementing log aggregation with OpenSearch and OpenTelemetry is crucial for operational efficiency within your startup. By proactively monitoring your logs and leveraging observability tools, you can catch potential issues before they escalate, ensuring customer satisfaction and empowering your team.
The urgency to adopt these tools cannot be overstated. Having a detailed view of what is going on in your systems at all times allows you to move fast with confidence.
So, take the plunge— Begin your journey in observability, integrate OpenSearch and OpenTelemetry to aggregate logs today. Your future self, your team, and your customers will all benefit from the proactive measures you take now.
Thanks for reading!