Self hosting full stack observability

“Move fast and break things”. Yes, but you must know when and how things break as soon as they fail so that you can learn and fix your mistakes. This idea applied to engineering means you must have eyes on your systems for you to move faster.
Enter observability.
Why your startup needs it
As your startup grows, you’ll face unique challenges that demand real-time performance insights. Rapid scaling can introduce complexities that affect service quality. Issues like latency and service disruptions can arise from increased traffic or a more intricate architecture, making it essential to keep a close eye on system performance.
Neglecting observability can lead to outages. Consider this: downtime costs businesses a lot of money. For a startup, this could translate to significant revenue loss and potentially devastating effects on customer trust and retention. A single outage can mean the difference between retaining a loyal customer and losing them to competitors.
Why self-host it
You need a system that watches over your systems. As you explore the market for such a solution you’ll encounter solutions that are priced quite high, insanely high at times. What if it is cost-prohibitive for you? What if you are not able to convince management to allocate you $8000 - $10,000 a month?
You’ll still need one. So In this article goes over how to set up a system that gives you a 360-degree view of your system on your own using open-source tools, without the outrageous SaaS bills.
With this setup, you’ll only pay for the hardware you use. All the tools used are completely open-source and free to use.
The architecture is designed to be progressive. Meaning, you can implement a simpler version to get started and add complexities as your need grows.
I will show you how.
What It Includes
To achieve full-stack observability, you’ll need to focus on several key components:
Logs
Centralized logging is crucial for effective debugging and monitoring applications. By aggregating logs across all your services, you streamline analysis and significantly reduce the time it takes to resolve issues. For instance, if an error occurs, having consolidated logs allows you to trace it back quickly to its origin.
Metrics
Similar to how Key performance indicators (KPIs) are essential for tracking progress in business, you need KPIs for system health and application performance in real-time. Visualization tools can provide actionable insights into operational status, helping you make informed decisions. Metrics like response times and error rates give you a pulse on how your application is performing under various loads.
Dashboards
Custom dashboards provide a comprehensive overview of your system’s performance metrics. By integrating multiple data sources into a single interface, you gain effective monitoring capabilities that empower your team to stay informed and respond swiftly to issues as they arise.
Traces
Tracing user requests helps you identify latency issues across services. By employing tools that visualize request flows and provide contextual information, you can pinpoint where bottlenecks occur. This is especially crucial in microservices architectures, where a single slow service can affect the entire user experience.
Alerts
Real-time notifications are vital for proactive incident management. Setting up customizable thresholds for alerts ensures that your team is alerted to critical performance issues without being bombarded by noise. You can prioritize alerts based on severity, allowing your team to focus on what truly matters.
Components and why each of them is chosen
The following are the major components required for the system.
OpenTelemetry
OpenTelemetry is essential for standardizing observability data collection across diverse tech stacks. Its auto-instrumentation capabilities for common programming languages reduce engineering overhead, allowing you to focus on product development. OpenTelemetry is vendor-neutral and has become the industry standard for collecting observability data.
OpenSearch
OpenSearch serves as a cost-effective solution for indexing and searching logs and traces. Its ability to handle large volumes of data efficiently makes it ideal for startups expecting rapid growth.
Prometheus
Prometheus excels at collecting and querying time-series metrics, particularly in cloud-native environments. Its reliability makes it a go-to choice for monitoring application performance in startups.
Grafana
Grafana is a powerful visualization tool that integrates seamlessly with multiple data sources, enabling dynamic dashboards for real-time insights. You will be using Grafana to build dashboards to monitor your systems and create alerts on the metrics.
Alertmanager
Alertmanager centralizes alert notifications to ensure your team remains aware of critical issues without being overwhelmed by noise. Configurable options allow you to prioritize alerts based on severity, helping your team focus on the most pressing concerns.
Kubernetes
Given the system consists of so many moving parts you need an orchestration system to make sure things are running reliably, which is where Kubernetes will help you. Even if the rest of the infrastructure is not in k8s, I would still recommend you use k8s for the observability system.
The architecture
Following will be the architecture of the full system.
Don’t be overwhelmed by it I will 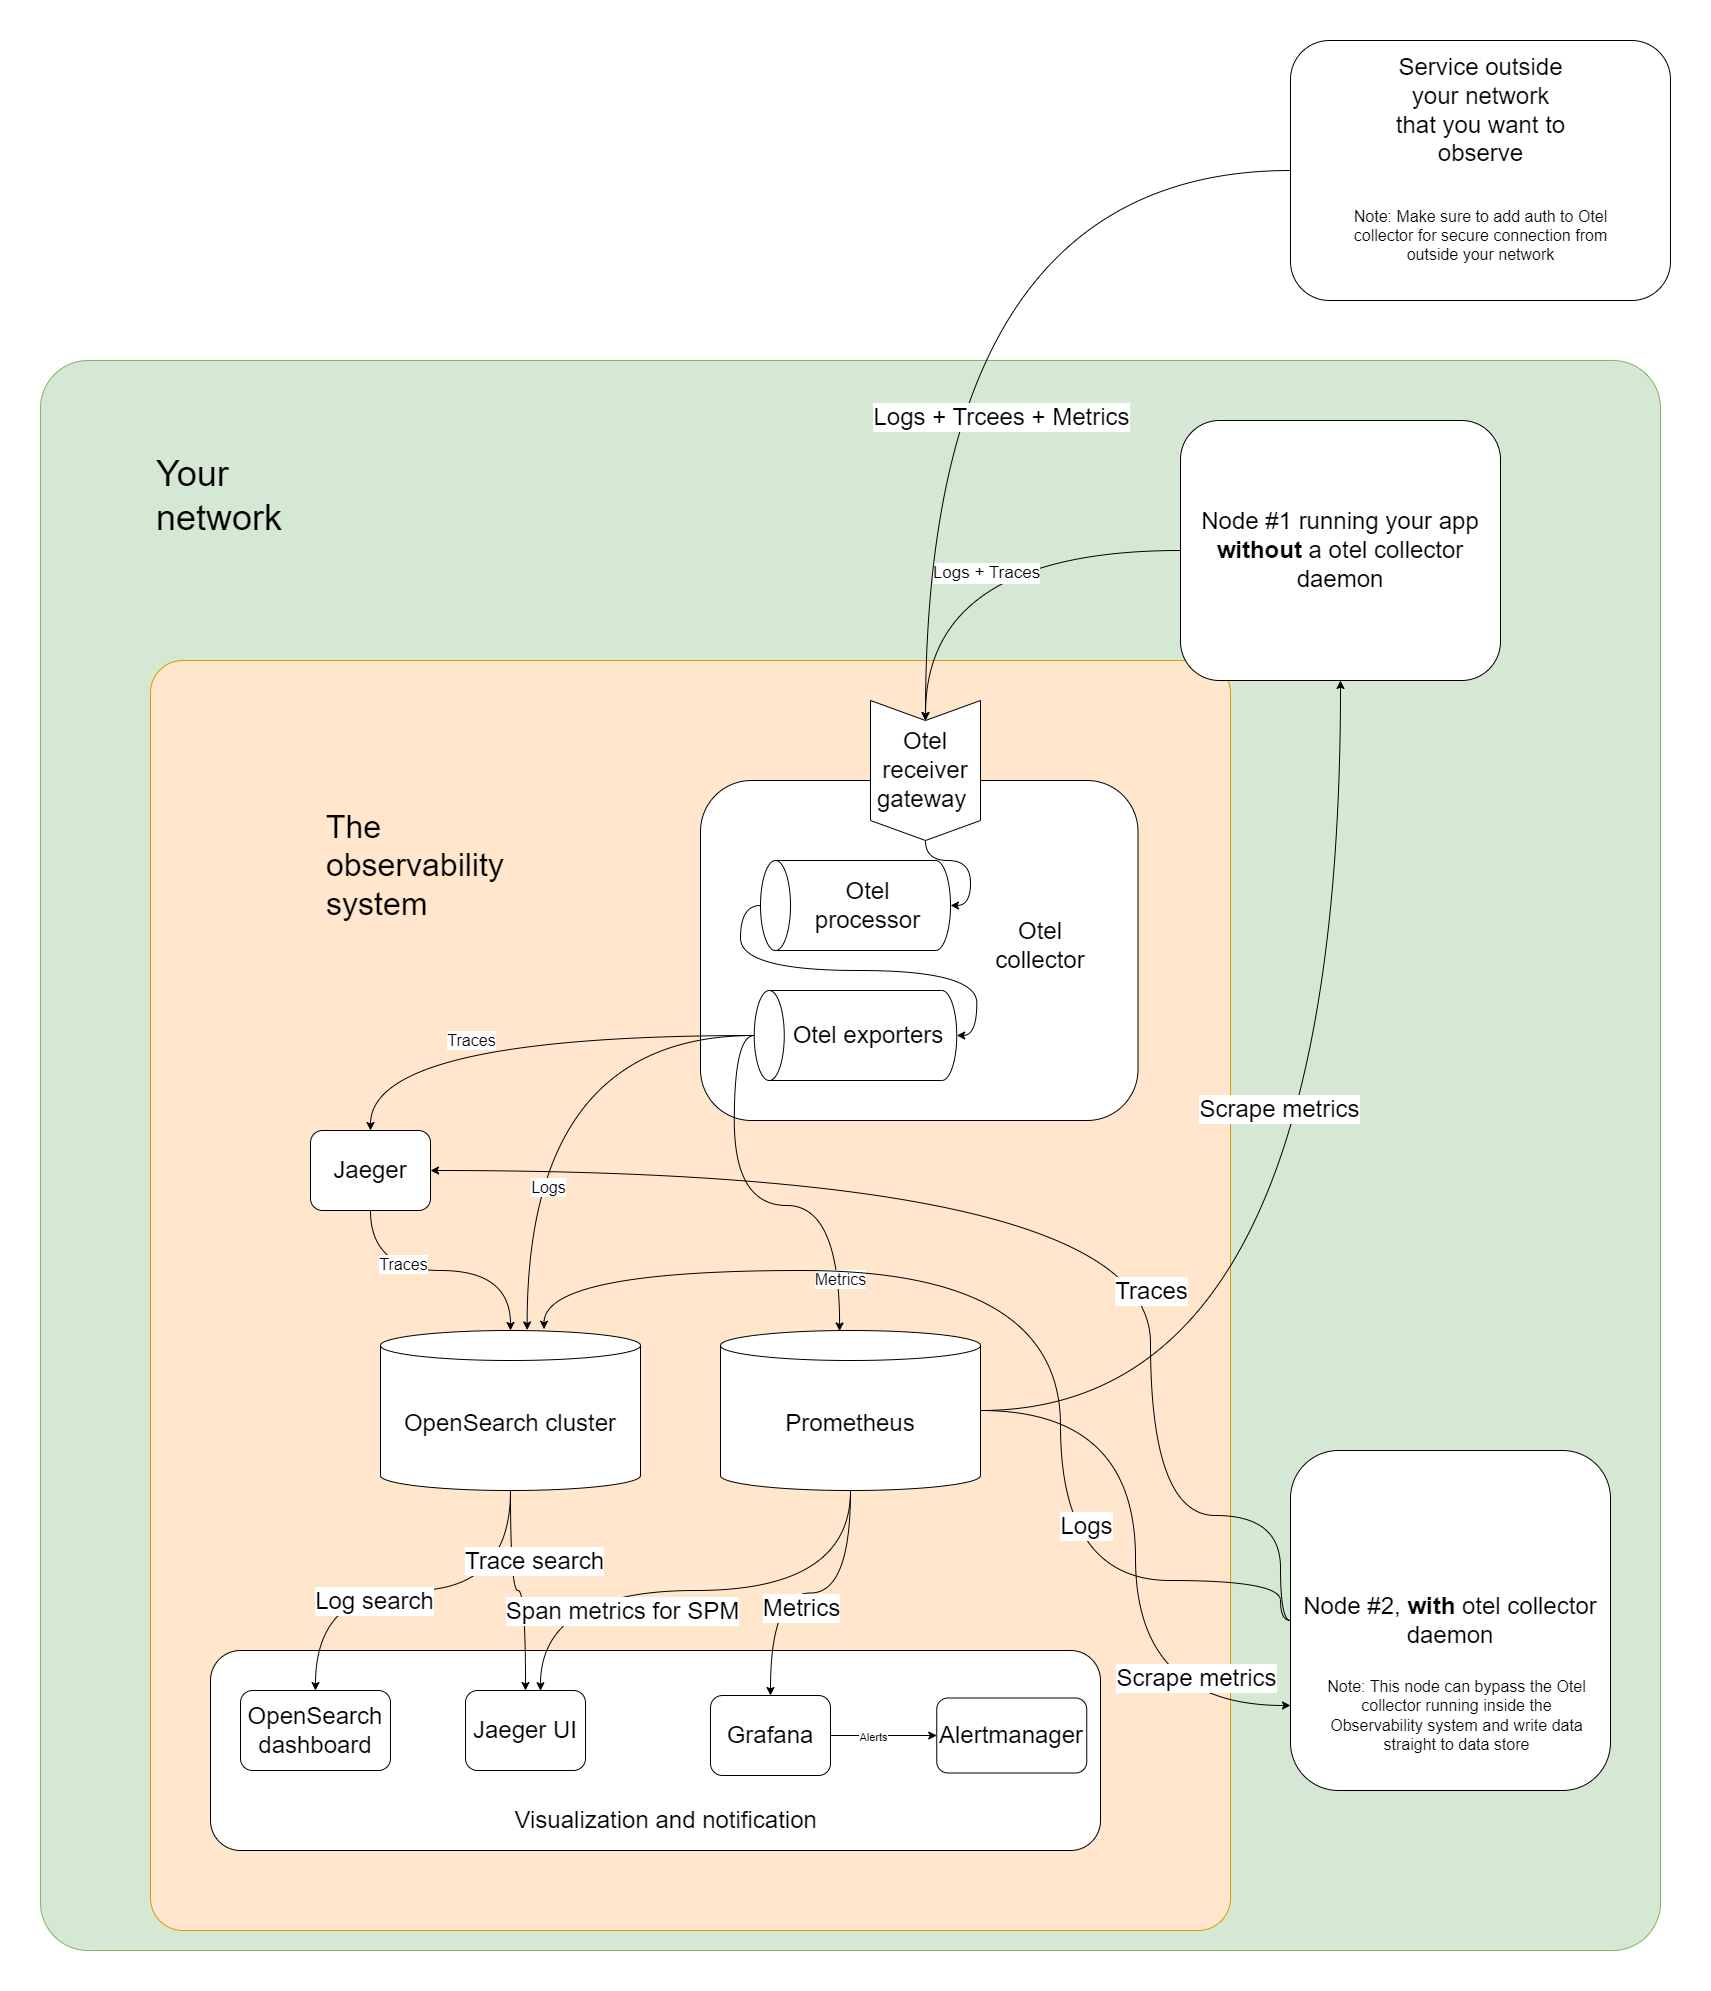 explain the architecture and how to progressively implement it.
Setup v1: The simplest setup
The heart of the system is the two data stores: Prometheus and OpenSearch. On top of that, you’ll have OpenSearch Dashboard for log searching, Jaeger UI for tracing, and Grafana for metrics.
In the v1 you’ll not have the separate Otel collector cluster (as shown inside “The observability system” in the diagram). You’ll run Otel collectors in every compute node you have(as a DaemonSet), which will collect the logs and traces and send them to OpenSearch and Jaeger directly. Prometheus will be configured to discover services and scrape the metrics.
This is the simplest setup and will take you a long way. Because you don’t have to think about scaling the Otel collectors an you are running multiple of them already.
However, the limitation of this setup is that when the volume of traces and logs gets high Otel collector will consume sizable resources in every compute node you have. At that point, you have to go through the full setup with an independent Otel collector cluster.
Setup v2: Full setup
In this one, you’ll have the Otel collector cluster in “The observability system” and you’ll be not running otel collector in every compute node. Instead, all your services will send their traces and logs to the otel collector cluster, which you’ll scale independently as needed.
Implementation
Implementation of the whole system in one blog post is not possible without turning this into a 6-hour read. So here I will give you entry points to explore how to set up each component of the system. Here I assume you will be using Kubernetes to manage components
- OpenSearch: In my experience, OpenSeach is the hardest and yet the most important piece of this puzzle. I would suggest you start with the OpenSearch operator which will help you a lot in maintaining the cluster.
- OpenTelemetry collector: I recommend the opentelemetry collector operator for running the otel collectors. Also read https://opentelemetry.io/docs/zero-code/ to learn how to instrument your services without any code.
- Jaeger: I will recommend the Jaeger operator to run Jaeger.
- Prometheus and Alertmanager: I will recommend the Prometheus operator to run Prometheus, which also includes Alertmanager.
- Grafana: I recommend using this helm chart to run Grafana.
Challenges in Implementation
As you start your journey on setting up your observability stack, you might encounter some challenges:
Resource constraints
Faced with limited resources, prioritize critical components first. Start with logging and metrics to establish a baseline observability strategy before expanding to traces and alerts. You can always iterate and improve as your team gains familiarity with the tools.
Integration complexities
Existing systems can pose integration challenges. A phased rollout strategy can help mitigate disruptions— instrument a small subset of the services to begin with.
Team training
Your team will need training to effectively use observability tools. Consider conducting hands-on workshops to ensure everyone is familiar with the tools
Conclusion
Self-hosting your full-stack observability is not just about implementing a set of tools; it’s about empowering your startup to make data-driven decisions for operational efficiency and user satisfaction. By taking control of your observability strategy, you can minimize downtime, optimize performance, and ultimately drive growth.
Are you ready to embark on your observability journey? Start today and transform how your startup approaches operational excellence! With the right tools and strategies, you can set your startup on a path toward success. Let’s make observability a core part of your operational strategy!